IT was another turbulent week at the spot auction and forward wool markets this week, with the constant volatility highlighting the value of having hedge limits in place.
Prior to the auction opening the 19 micron index traded at a premium of 50 cents out to May 2021 heralding a strong opening. The price surge Tuesday saw 19 micron trade up to 1420 cents for maturities in November and January.
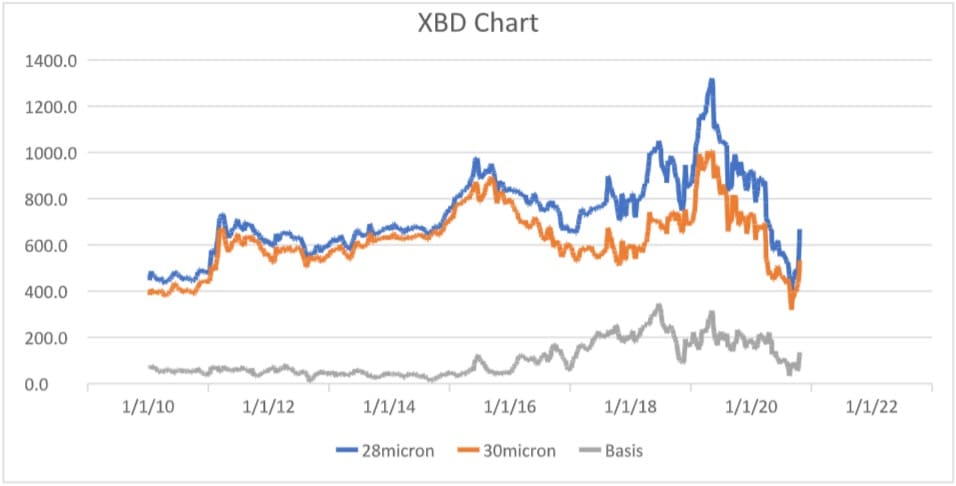
The auctions Wednesday lost momentum with the Merinos wools, giving back around a third of their 100 cent-plus gains. However, it was still a very positive outcome for the week, particularly for the crossbreds. The 28 micron index’s rise of 150 cents and the 100-cent lift in the 30 micron index has crossbred growers now looking for hedges into the late Spring through to the early New Year.
Forward action continued for the 21 micron index on Thursday. In January, it traded at 1180 cents. This was discounted to the closing spot market, but well above the prevailing levels of the past month.
Indicative levels on Merino indexes are a little hard to gauge, with volatility king. Most Merino qualities have risen more than 50 cents a day for the last four consecutive trading days. Bid offer spreads will remain wide until consolidation of the true levels from offshore.
Trade summary
19 micron 21 micron
October 1360 cents 1180 cents
Nov/Dec 1360 cents 1180 cents
Jan/Feb 1320 cents 1180 cents
Mar/April 1300 cents 1160 cents
May/June 1280 cents 1140 cents
This week’s trades
November 19 micron 1350/1420 cents 22 tonnes
November 19.5 micron 1285 cents 2 tonnes
November 21 micron 1260 cents 7.5 tonnes
January 2021 19 micron 1320/1420 cents 8 tonnes
January 2021 21 micron 1180 cents 10 tonnes
April 2021 19 micron 1320 cents 5 tonnes
May 2021 19 micron 1350 cents 2 tonnes
TOTAL 58.5 tonnes


What complete nonsense. Every time price volatility appears in a market — not just wool — the market analyst sages (aka screen jockeys) appear with the comforting advice that price hedging is a sensible, if not mandatory tactic.
Look, I hate to spoil the party, but just ignore it. It sounds sexy and sophisticated, but some years ago we looked at the net result of hedging wool, wheat and canola in our benchmarking database, hundreds of trades over more than ten years. Net result? A loss for all three commodities.
If you are still keen, try this quick test. Print off an historical price graph for a wool type in a volatile price period and remove the years from the X-axis, call them 1, 2, 3…. instead. Cover the graph with a sheet of paper and slowly slide it to the right to reveal the price trend. Ask him/her when to lock in. Repeat the exercise at least ten times with different price graphs. Don’t be amazed if they get a few right, as that is just random chance.
Why the wool industry continues to show interest in this nonsense is no surprise really, as there is no shortage of other nonsense to distract producers.