 MARKET and flock dynamics mean Australia’s sheep and lamb numbers are unlikely to increase rapidly, despite productivity gains indicated in the latest Agricultural Census data.
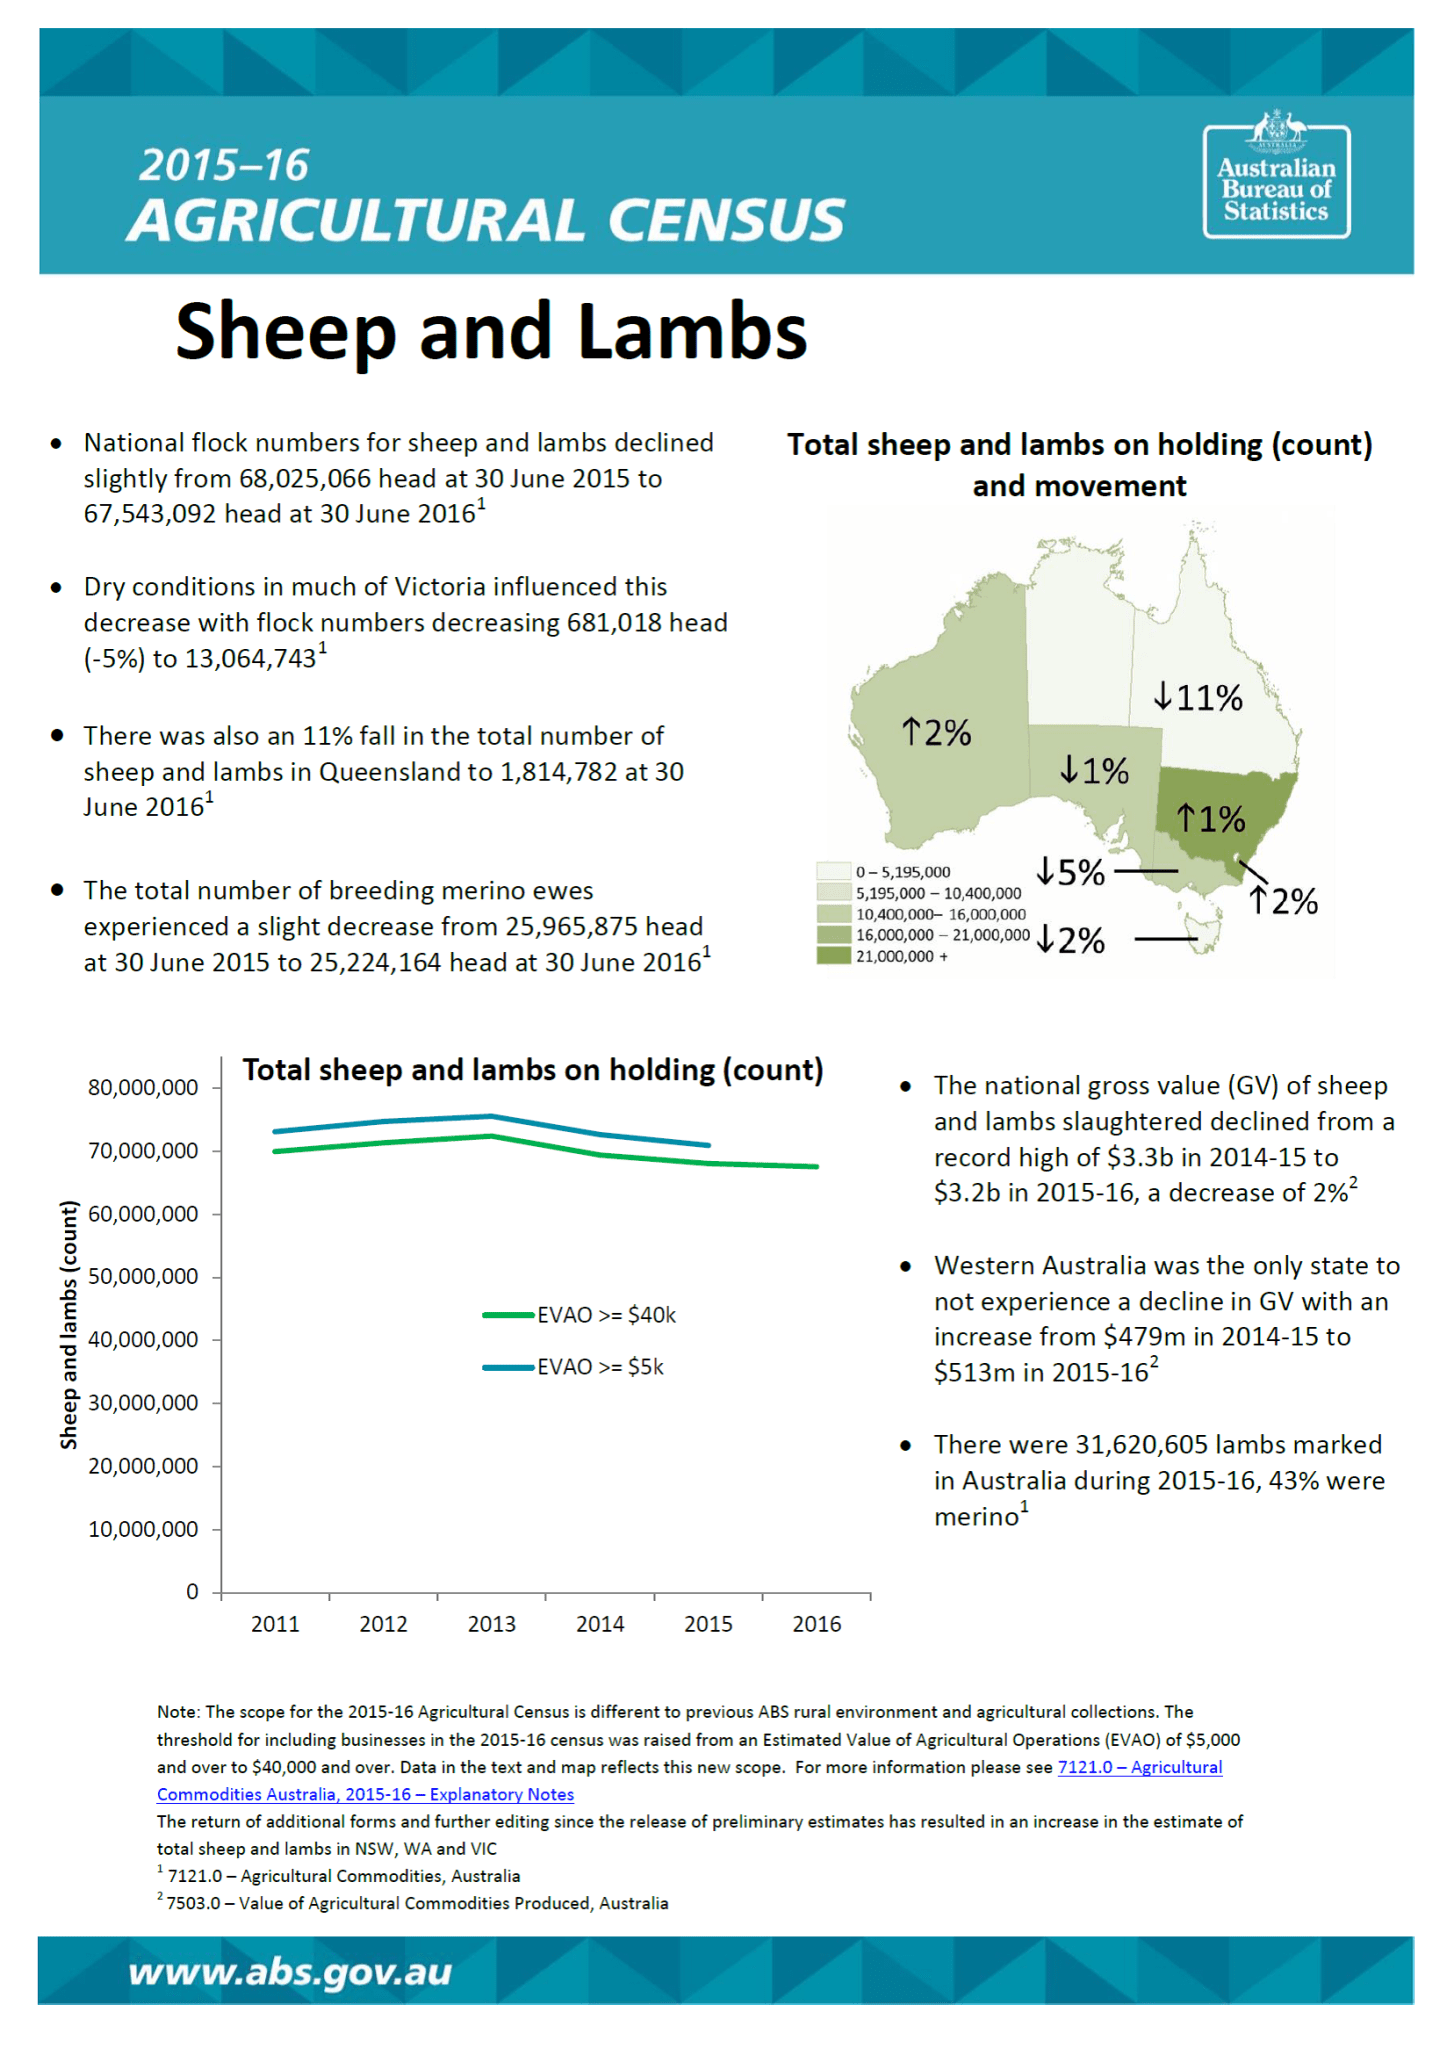
The Australian Bureau of Statistics latest 2015-16 Agricultural Census indicates that the country’s flock has decreased 3 percent from the previous 2010-11 census to 67.5 million sheep and lambs.
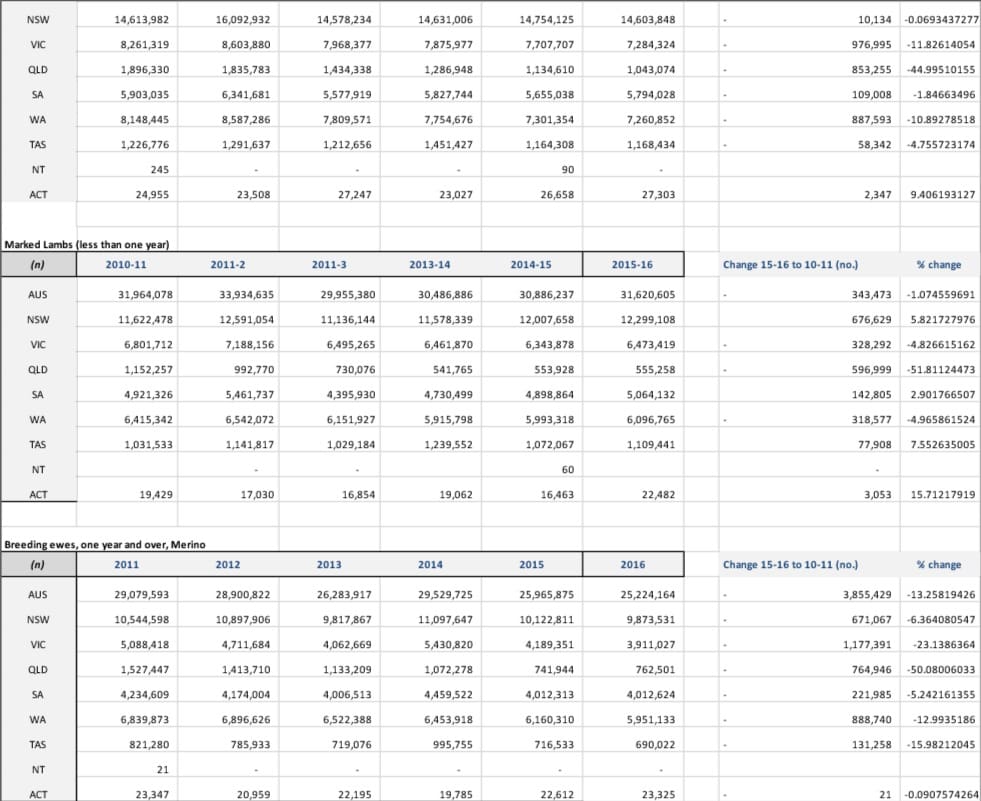
The number of all breeding ewes fell by 7pc to 37.2 million since 2011, yet the number of lambs marked in 2016 represented only a 1pc fall to 31.6 million, due to increased marking percentages.
However, New South Wales Department of Primary Industries livestock systems technical specialist Phil Graham said the changes in the flock are very small and trends outside those affected by seasonal conditions are difficult to determine.
Mr Graham said lamb marking rate changes have to be considered in the context of seasonal conditions.
“You can’t compare marking rates across years unless you do something to take account of seasonal conditions.”
Mr Graham said the current dynamics of the market, the flock size, and strength of the domestic and export lamb markets and oversea mutton demand, mean there is “no way the ewe flock can increase rapidly.”
“It’s just a numbers game; the people who have sheep are keeping them and maybe trying to build numbers.
“The people with money who want to get into sheep are having trouble finding them,” he said.
Mutton prices are encouraging people to sell old ewes, but if they dropped, Mr Graham believed ewe numbers would rise.
“So I just can’t see any rapid change in numbers either way; I don’t think we are going to drop much and I don’t think we are going to go up much.”
Sheep producers doing better with fewer ewes
The ABS used a new Estimated Value of Agricultural Operations criteria for including farms in the 2015-16 Agricultural Census, limiting it to those with an EVAO of $40,000 and above. The previous criteria was $5000 and above.
Livestock Dynamics analyst Kimbal Curtis said the new EVAO basis reduced the comparable sheep and lamb estimate for the 2010-11 census from 73.1 million to 69.9 million, or 4pc less.
Mr Curtis’ comparison of the latest census flock figures with the 2010-11 data under the new EVAO basis indicates Australian producers have nationally managed to lift the number of lambs marked per 100 ewes joined in the intervening five years, despite some dramatic flock structure changes in the sheep-producing states.
He said 7pc decline in ewe numbers from 2011 to 2016 included a 13pc decrease in Merino ewes from 29.1 million to 25.2 million.
“However, lambs marked only decreased by 1pc from 32 million to 31.6 million.
“Merino lamb markings remained unchanged at 13.6 million, partly due to an increase in the proportion of Merino ewes mated to Merino rams, up from an estimated 65pc to 70pc in 2015-16,” he said.
“Improved ewe management and lamb survival would appear to have allowed producers to maintain lamb production from fewer ewes.
“Between 2010-11 and 2015-16, marking rates have increased from 89pc to 97pc for all ewes nationally, and from 80pc to 87pc for Merino ewes,” Mr Curtis said.
“We’re actually doing better with less.”
Mr Curtis said New Zealand sheep production started on a similar trend several years ago as the NZ flock shrunk in the face of competition from dairy land demand.
“The big thing for us is that there has been a reduced number of ewes, but we are still turning off almost as many lambs.”
As a result of the increased marking rates in 2015-16, lambs accounted for 32pc of the population in 2016 up from 30pc in 2011, he said.
“This increased component of the flock has been at the expense of breeding ewes, down from 57pc to 55pc.
“The other sheep category, largely wethers, remain at about 13pc perhaps reflecting support for wool production,” he said.
Mr Curtis said he chose to compare the latest agricultural census figures with the 2010-11 census because it was a “better collection” and the ABS surveys in the intervening years from 2011 to 2015 had smaller sample sizes and results tended to be “up and down”.
“They censuses have a finer resolution, they go down to smaller land areas, they have a much bigger sample size and I also think that the longer time period gives you a feel for changes that have happened rather than the statistical error that you get with a year-to-year variance.”
Dr Curtis said New Zealand sheep production started on a similar trend several years ago as the NZ flock shrunk in the face of competition from dairy land demand.
“The big thing for us is that there has been a reduced number of ewes, but we are still turning off almost as many lambs.”
State flock changes in past five years
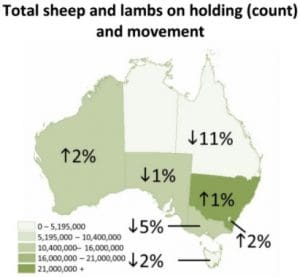
The latest ABS Agricultural Census indicate flock increases in New South Wales, South Australia and Western Australia since 2011. The NSW flock increased 2.25pc to 25.97 million, the South Australian sheep and lamb numbers rose 1.54pc to 10.74 million and the WA flock lifted 1.37pc to 13.86 million.
Queensland recorded the largest drop in sheep and lamb numbers; by 48.6pc to 1.81 million, followed by Victoria down 9.9pc to 13.06 million and Tasmania, down 7.26 million to 2.04 million.
Breeding ewe numbers dropped in all states in the past five years. The decline was led by Victoria losing 11.8pc or almost 997,000 ewes, followed by Western Australia down 887,593 ewes or 10.0pc, Queensland down 853,225 ewes or 45pc, South Australia down 109,008 ewes or 1.8pc and Tasmania down 58,342 ewes or 4.8pc.
Victoria also lost the most Merino ewes, one year and over, since 2011, with numbers dropping 1.18 million or 23.1pc. It was followed by Western Australia losing 888.740 Merino ewes, a fall of 13pc. Queensland lost half its Merino ewe flock or 764,946 ewes since 2011. Merino ewe numbers dropped by 671,067 or 6.4pc in New South Wales, by 221,985 ewes or 5.2pc in South Australia, and by 131,258 or 16pc in Tasmania.
Further details are available in Agricultural Commodities, Australia (2015-16) (cat. no. 7121.0) available for free download from the ABS website www.abs.gov.au
Click here for more 2015-16 ABS Agricultural Census sheep and lamb details.
Click here for ABS full national and state sheep and lamb details 2010-11 to 2015-16.
Source: Livestock Dynamics, NSW DPI.
Let’s ignore the figures which go up and down, but claim a trend from the figures we like?
The one sound comment in the article was “You can’t compare marking rates across years unless you do something to take account of seasonal conditions.” I wonder if the next census year is a drought whether a change in trend will be reported or a different set of figures will be needed to support the needs of the time.