AUSTRALIA’S sheep flocks shrunk slightly but became more numerous, with significant changes in state flock sizes, in the five years to 2021, an analysis of ABS Agricultural Census data has shown.
Sheep numbers have been falling in New South Wales – Australia’s largest sheep state – and in Western Australia, but rising in Victoria, Tasmania, Queensland and South Australia, according to the analysis by Meat & Livestock Australia.
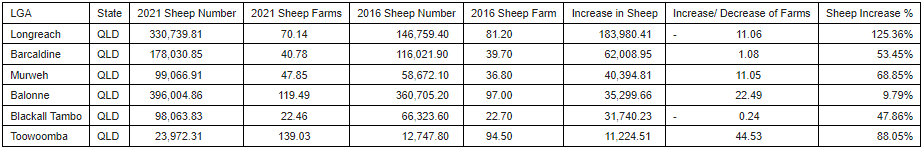
And consistent with the recent development of exclusion fencing in parts of western Queensland, some local government areas have seen dramatic flock growth – by up to 125 percent in Longreach and 88pc in Toowoomba.
In the five years to 2021, the sheep population in Longreach increased from 146,000 head to 330,739 head. The number of sheep enterprises in Longreach fell 13pc to 70 enterprises, indicating existing sheep farms increasing scale. See the MLA table below.
The largest increase in sheep numbers for any LGA was in Victoria’s Southern Grampians Council where numbers grew 367,803 head or 18pc. The next largest increase 260,653 head in the Northern Midlands area of Tasmania. Next in line were Ararat and West Wimmera in Victoria, and Longreach in Queensland with their sheep numbers each lifting by more than 177,600 head.
The analysis also showed the rising in breeding ewe numbers and fall in wethers on properties and the trend toward non-Merino breeding ewes.
The MLA review of the ABS Agricultural Census data has shown that the NSW flock fell 1.3 million head or by 5 percent to 24.7m and Western Australia’s flock dropped 8pc or 1.15m head to 12.7m.
In Victoria, the flock rose by 2.3 million head or 18pc to 15.4 million head. In Queensland, sheep numbers increased 15pc or 265,000 head to 2.08m head and in Tasmania by 16pc or 327,000 head to 2.4m. South Australia’s flock rose to 12.7m.
The overall result of the flock size changes was an increase in the national flock by 500,000 to 68m in the period.
More sheep properties but smaller flocks
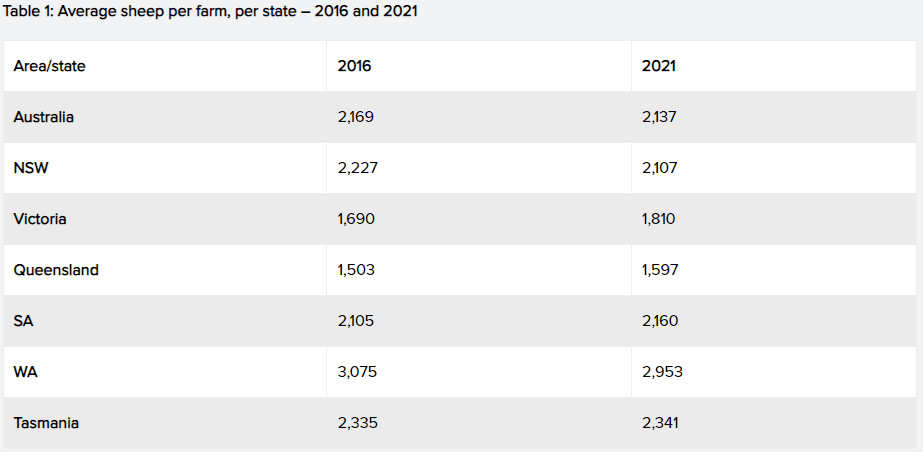
Western Australia had the largest average flock size in 2021. Source – MLA, ABS data.
MLA market information manager Stephen Bignell said from 2016–2021, the number of properties running sheep nationally increased by 703, or 2pc, to 31,839, although there were some difference between states. However, the average number of sheep held per property fell slightly, down 30 head per property nationally, from 2169 to 2137 head.
In NSW, despite the state’s overall flock reduction, the number of businesses running sheep increased 1pc or 70 farms, whereas in Victoria there has been an 18pc increase in the number of businesses running sheep. The new businesses did not have flocks five years ago, he said. By comparison, in SA, the number of sheep increased, but the number of enterprises fell, indicating fewer enterprises running larger flocks.
MLA found that producers in Queensland and Victoria tend to have smaller flocks per property, under 2000 head per enterprise. In WA, with the flock size and number of sheep businesses decreasing – from above 3000 head to 2953 per enterprise – the average flock per enterprise remained the largest in the country.
Mr Bignell said the changing sheep demographics is positive and contrary to many reports that the number of sheep, and number of sheep businesses in Australia is in structural decline.
“You hear a lot about people pulling fence out and going cropping, but what it means is that people realise that there is a symbiotic relationship between sheep and cropping.”
He said although there has been a slight drop in the number of business running sheep, it is not indicative of the “doom and gloom” reflected in some reports.
Cattle and cropping increased
The analysis showed that over the past five years, the number of businesses running cattle has grown 1.6pc, or 736 farms, to 47,757. The number of cattle per enterprise fell by half a million head, or 2pc, causing the number of cattle to fall to 511 head per business, reflecting some impact by the 2017–2019 drought.
MLA said that between 2016 and 2021, there was a 12pc increase in the area of land planted to wheat, despite only a marginal increase in the number of properties growing wheat – up 1pc from 18,893 to 19,120.
This indicated that producers harnessing strong growing conditions in the past few years, have dedicated more land to wheat and cereal crops, MLA said. The area of wheat planted by businesses grew by 10.7pc to 661ha. Plantings of chickpeas, maize, sugarcane and cotton fell in the 2016–2021 period.
M:LA said that contrary to popular belief, it isn’t WA, Victoria or SA that represent Australia’s mixed enterprise heartland.
The most recent ABS Agricultural Census data identified that there were only five shires in Australia – Forbes, Bendigo, Wagga Wagga, Corowa and Goondiwindi – that truly had equal amounts of agricultural land used for crop production and grazing. However, there are 93 shire areas that operate in within the 40-60pc grazing land parameters – which would classify them as mixed enterprise regions.
Sources – MA, ABS.
HAVE YOUR SAY