Winter rainfall across eastern Australia and in southwest Western Australia has made a significant difference to growing conditions.
Rainfall totals in excess of 100mm for the month have allowed the feedbase to respond with early growth and a general increase in total standing dry matter amounts.

Imagery and analysis provided by CiboLabs
Total Standing Dry Matter
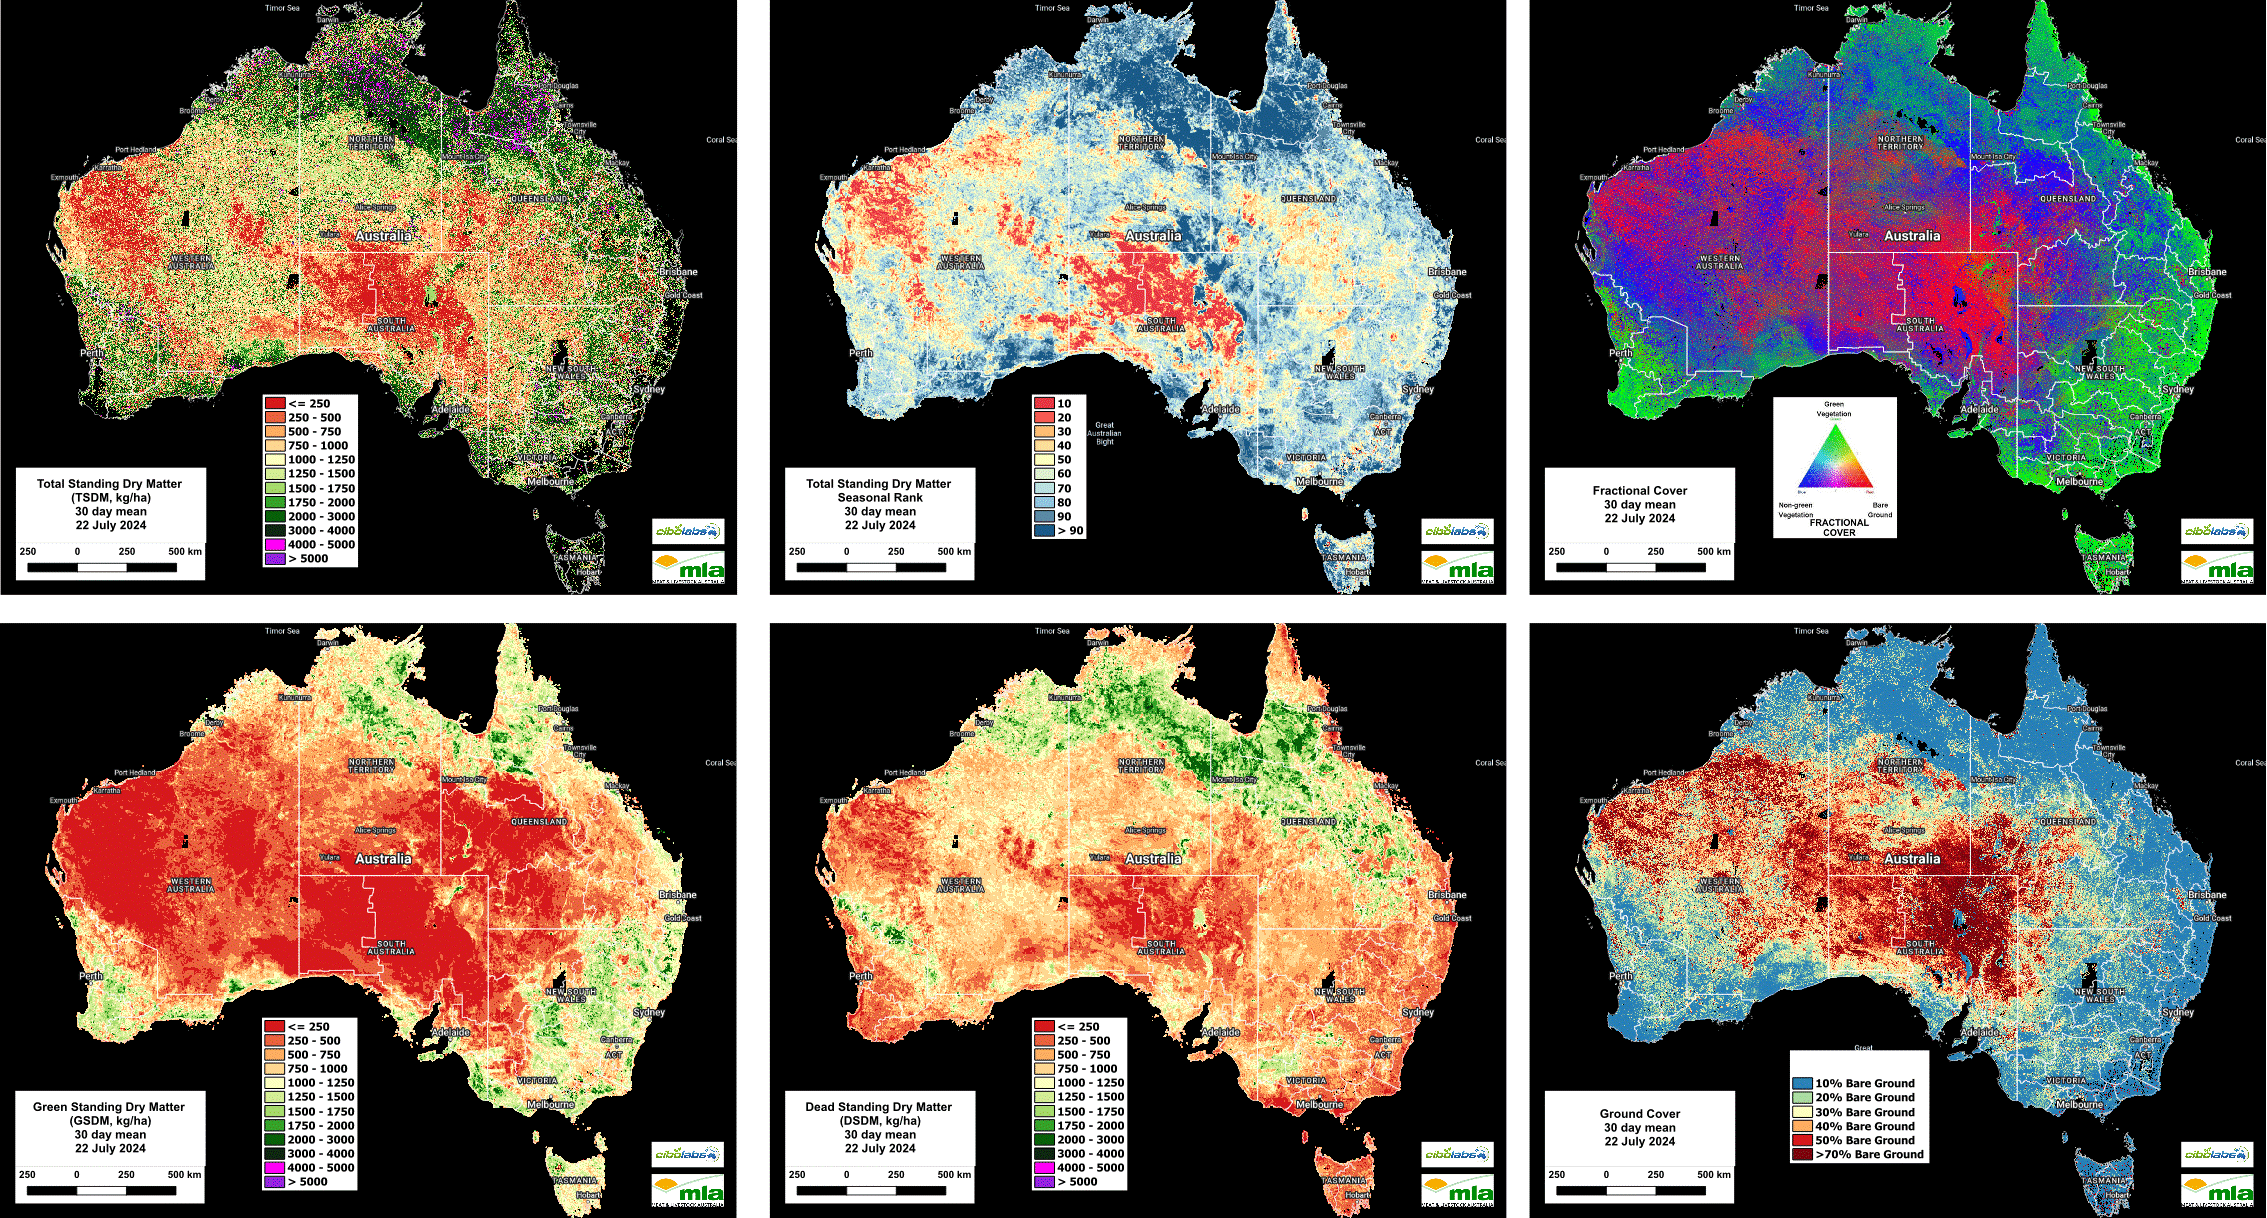
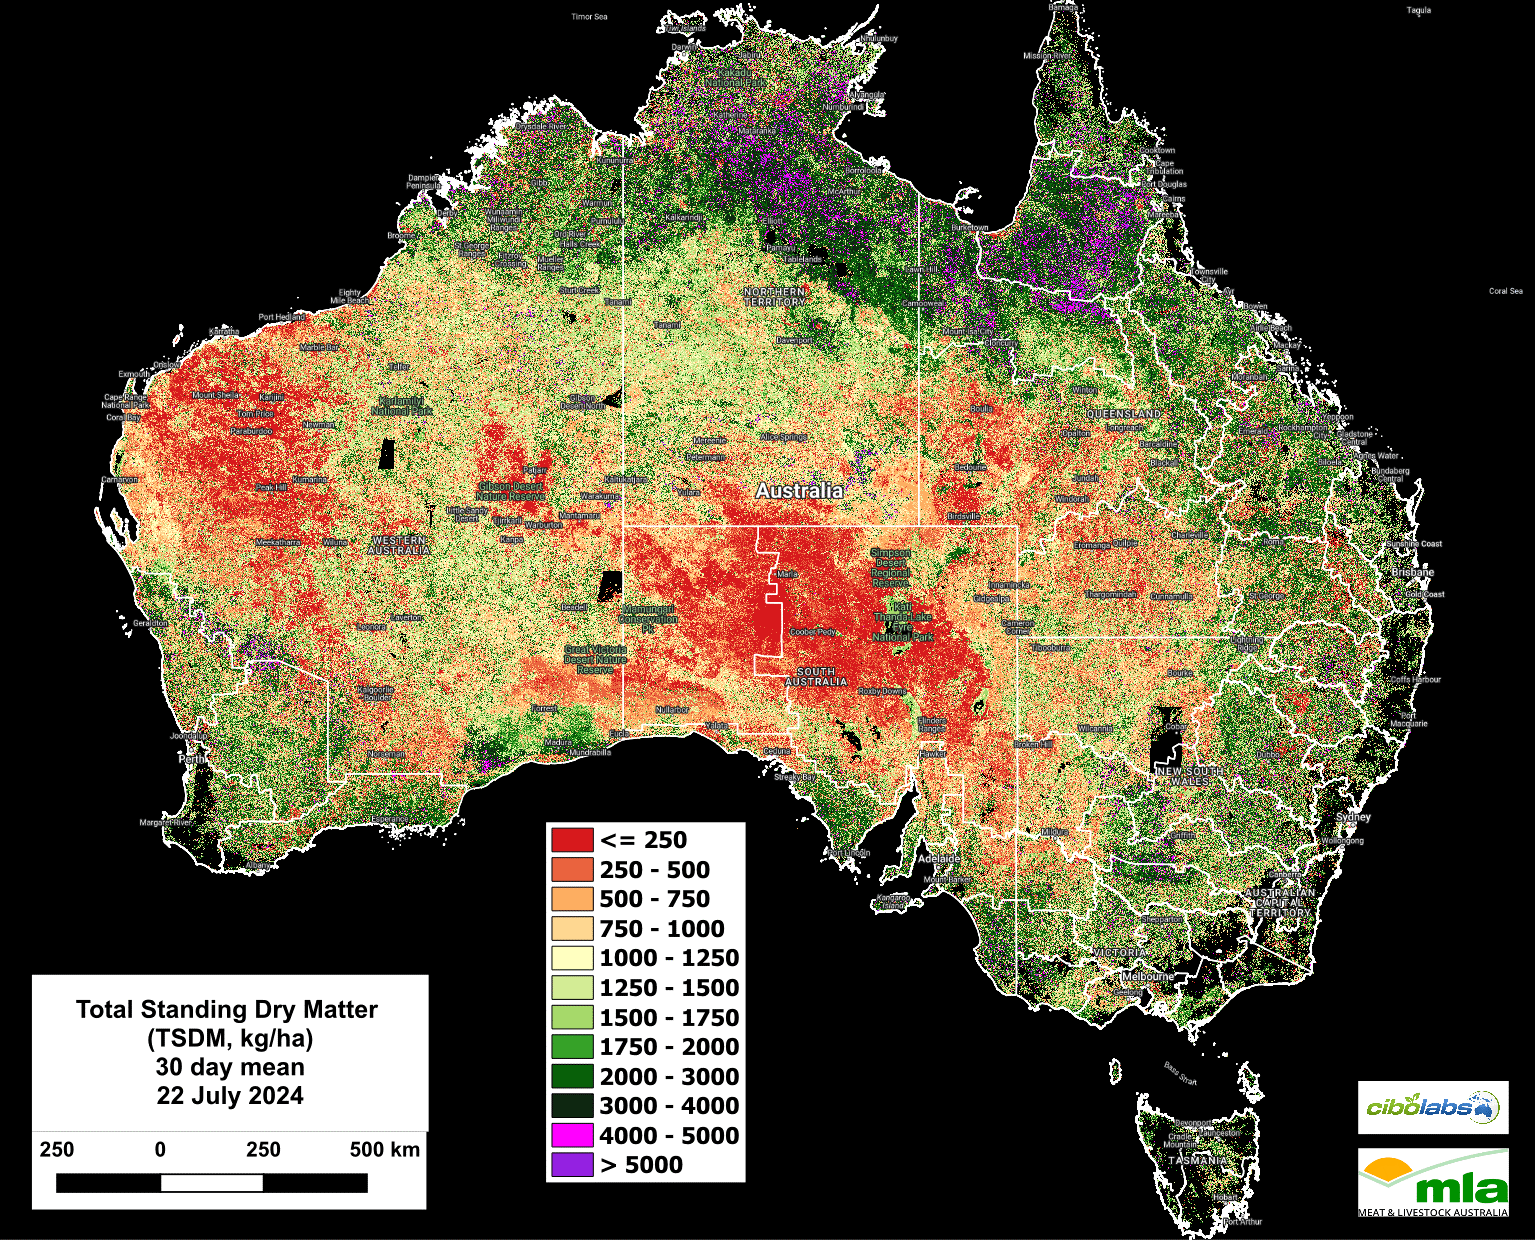
The National TSDM map shows positive accumulation of dry matter across Tasmania and the Bass Straight Islands as well as across Victoria, southeastern South Australia and in the southwest regions of Western Australia.
This is a positive development for graziers in these regions. In eastern Australia TSDM continues to increase across the eastern half of NSW & eastern Queensland.
Seasonal Comparison Total Standing Dry Matter
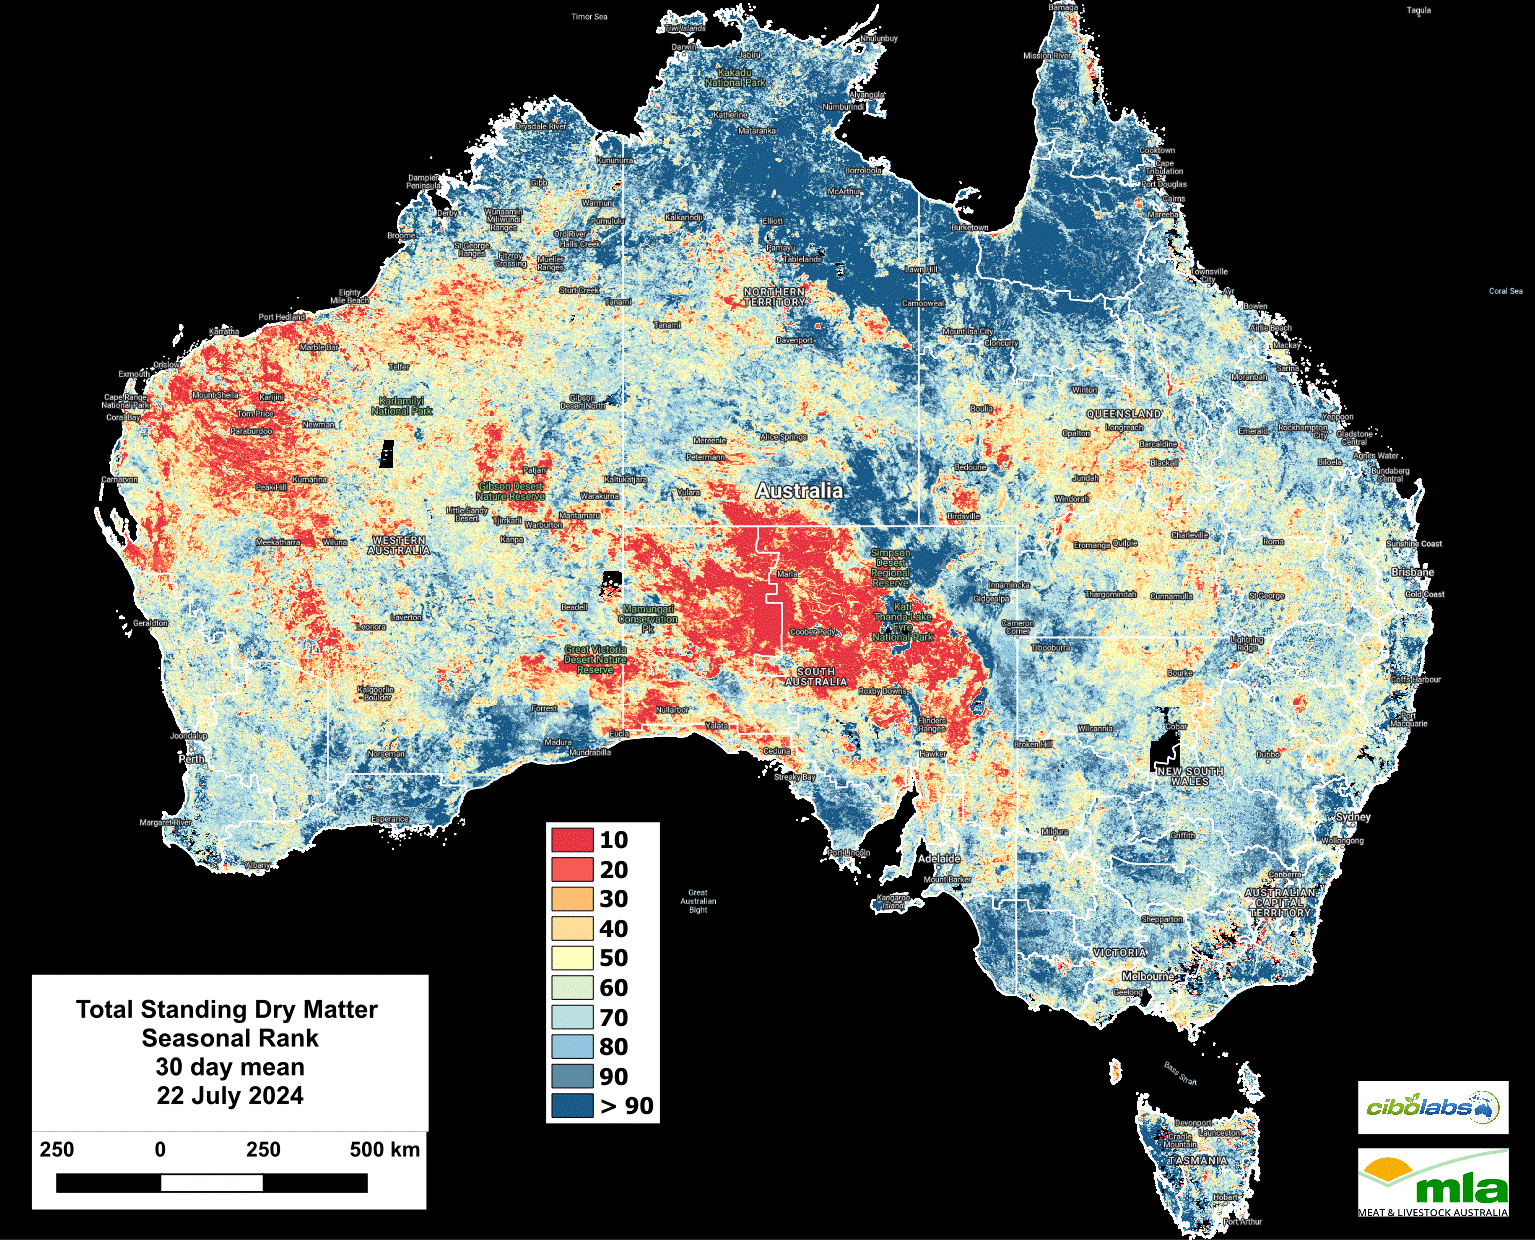
Although there are positive trends emerging in the national feedbase, the seasonal ranking (Figure 2) highlights how far behind many parts of southern Australia are in comparison to the 8-year average.
Areas of Tasmania, Victoria and much of central and eastern South Australia are still well below the average for this time of the year, which does still pose a challenge for graziers.
Central Queensland also largely remains below average, with producers needing to monitor the next few weeks closely.
Fractional Cover (Growth)
Active growth events, as represented by Fractional Cover (Image 3) reflect the extent of rainfall recorded during July.
Despite some large areas of frost and low temperatures, growth has persisted across eastern states and into tropical Queensland.
Green Total Standing Dry Matter
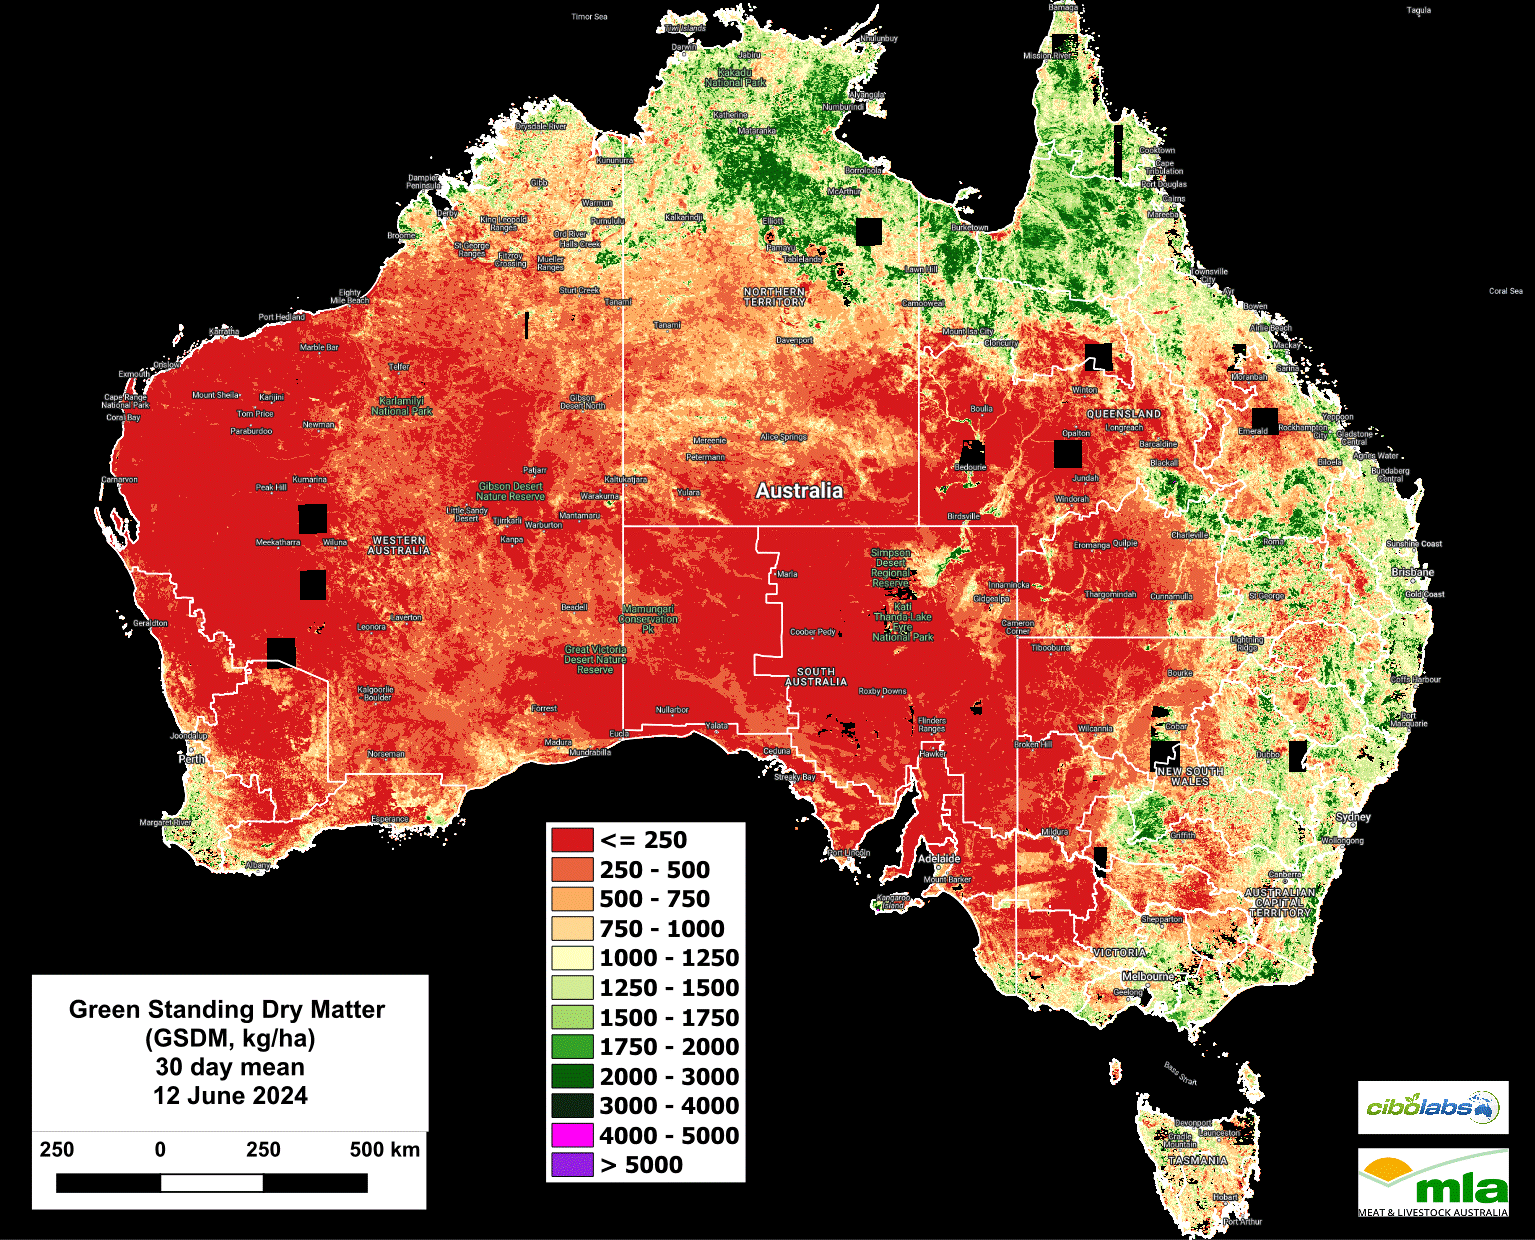
Levels of green standing dry matter levels (Image 4) are showing an increasing trend in southern Australia.
In northern Australia, the high soil moisture levels across areas including the Barkly, Gulf and lower Cape York regions have seen levels of green dry matter significantly persist.
Dead Standing Dry Matter
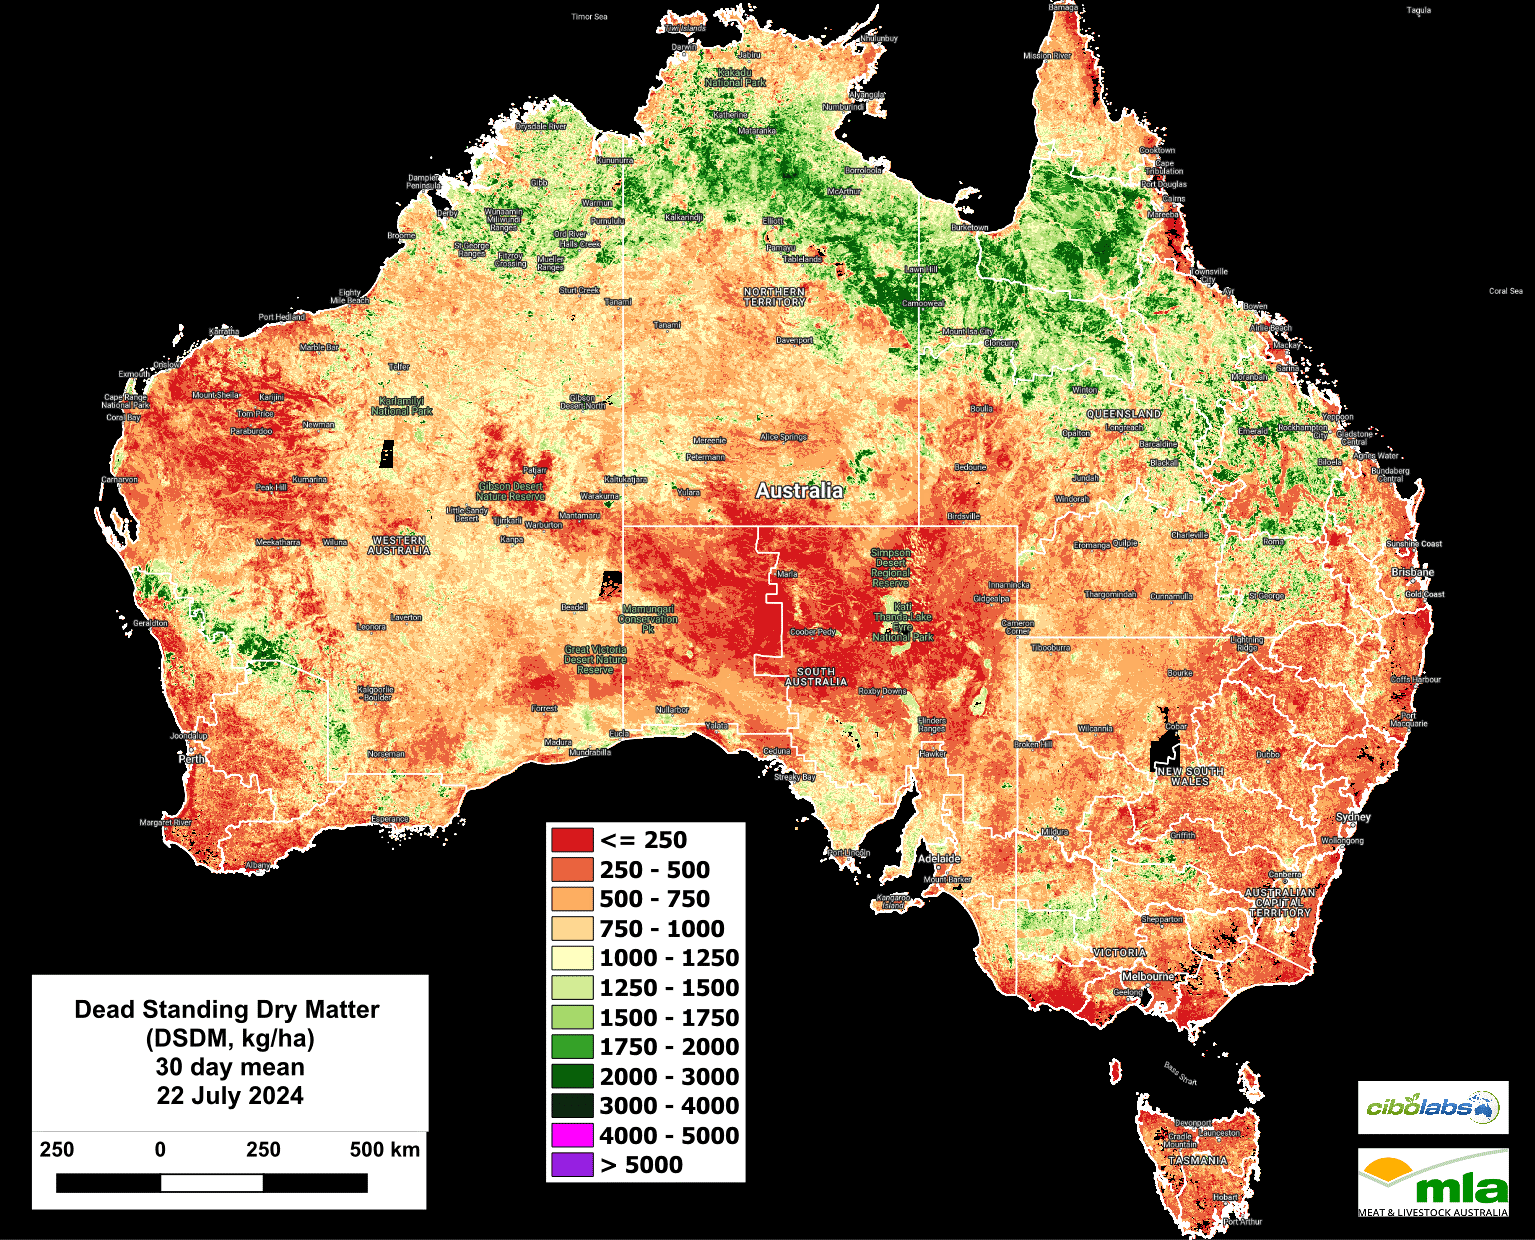
Dead Standing Dry Matter (Image 5) levels remain very high across northern Australia and through into central Queensland.
These large areas of dry standing material form a useful feed source; however, the excessive amounts (over 2000kg DM) may cause some issues as the dry season continues and the risk of fire increases.
Monthly Ground Cover levels
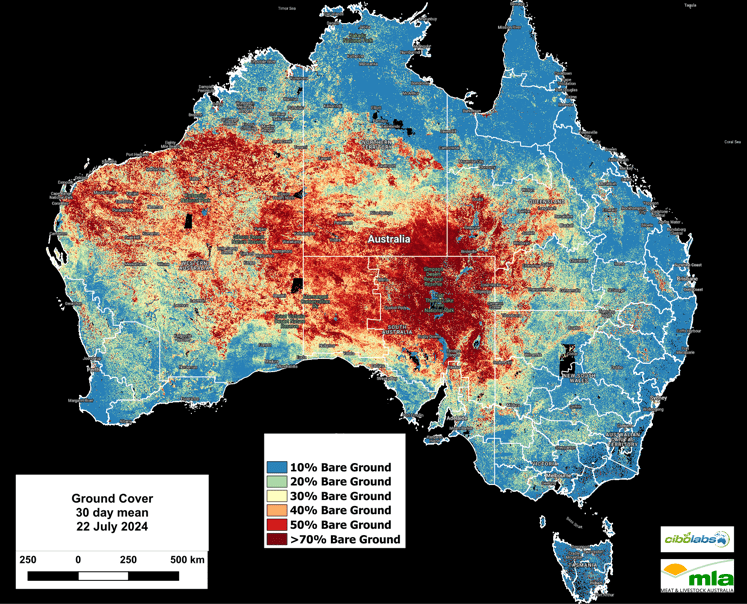
Ground cover levels remain largely similar to previous observations with no significant alterations noted. (Image 6)
For more localised information including regional level overviews, users are encouraged to explore the Cibo Labs Regional Comparison. This tool provides regional data that may show the impact of localised weather or fire events. A further level of detail for individual properties is available for users who have created an Australian Feedbase Monitor account, which can be accessed both through the MyMLA portal or through the Cibo Labs website.
The Cibo Labs National Comparison can be used to freely access these layers (https://www.cibolabs.com.au/products/national-comparsion/) to view the most recent images from a national, state or catchment level.
This tool can complement the Australian Feedbase Monitor which can also be created within the Cibo Labs Web Site www.cibolabs.com.au


HAVE YOUR SAY