National Summary
AUSTRALIA’S feedbase continues to show considerable variability with the influence of storms, and temperature extremes experienced in many areas over recent weeks playing a significant role on the levels of green standing dry matter as well as on the overall levels of total standing dry matter.
While Queensland and New South Wales have benefited from recent rainfall, large areas of South Australia, Western Australia and western Victoria remain dry. The Bureau of Meteorology reports that January 2025 was the second-warmest January on record, impacting soil moisture, pasture growth, and water storage levels. This update does not yet reflect the impact of recent flooding in far north Queensland.
![]()
Imagery and analysis provided by CiboLabs
Regional trends in biomass growth
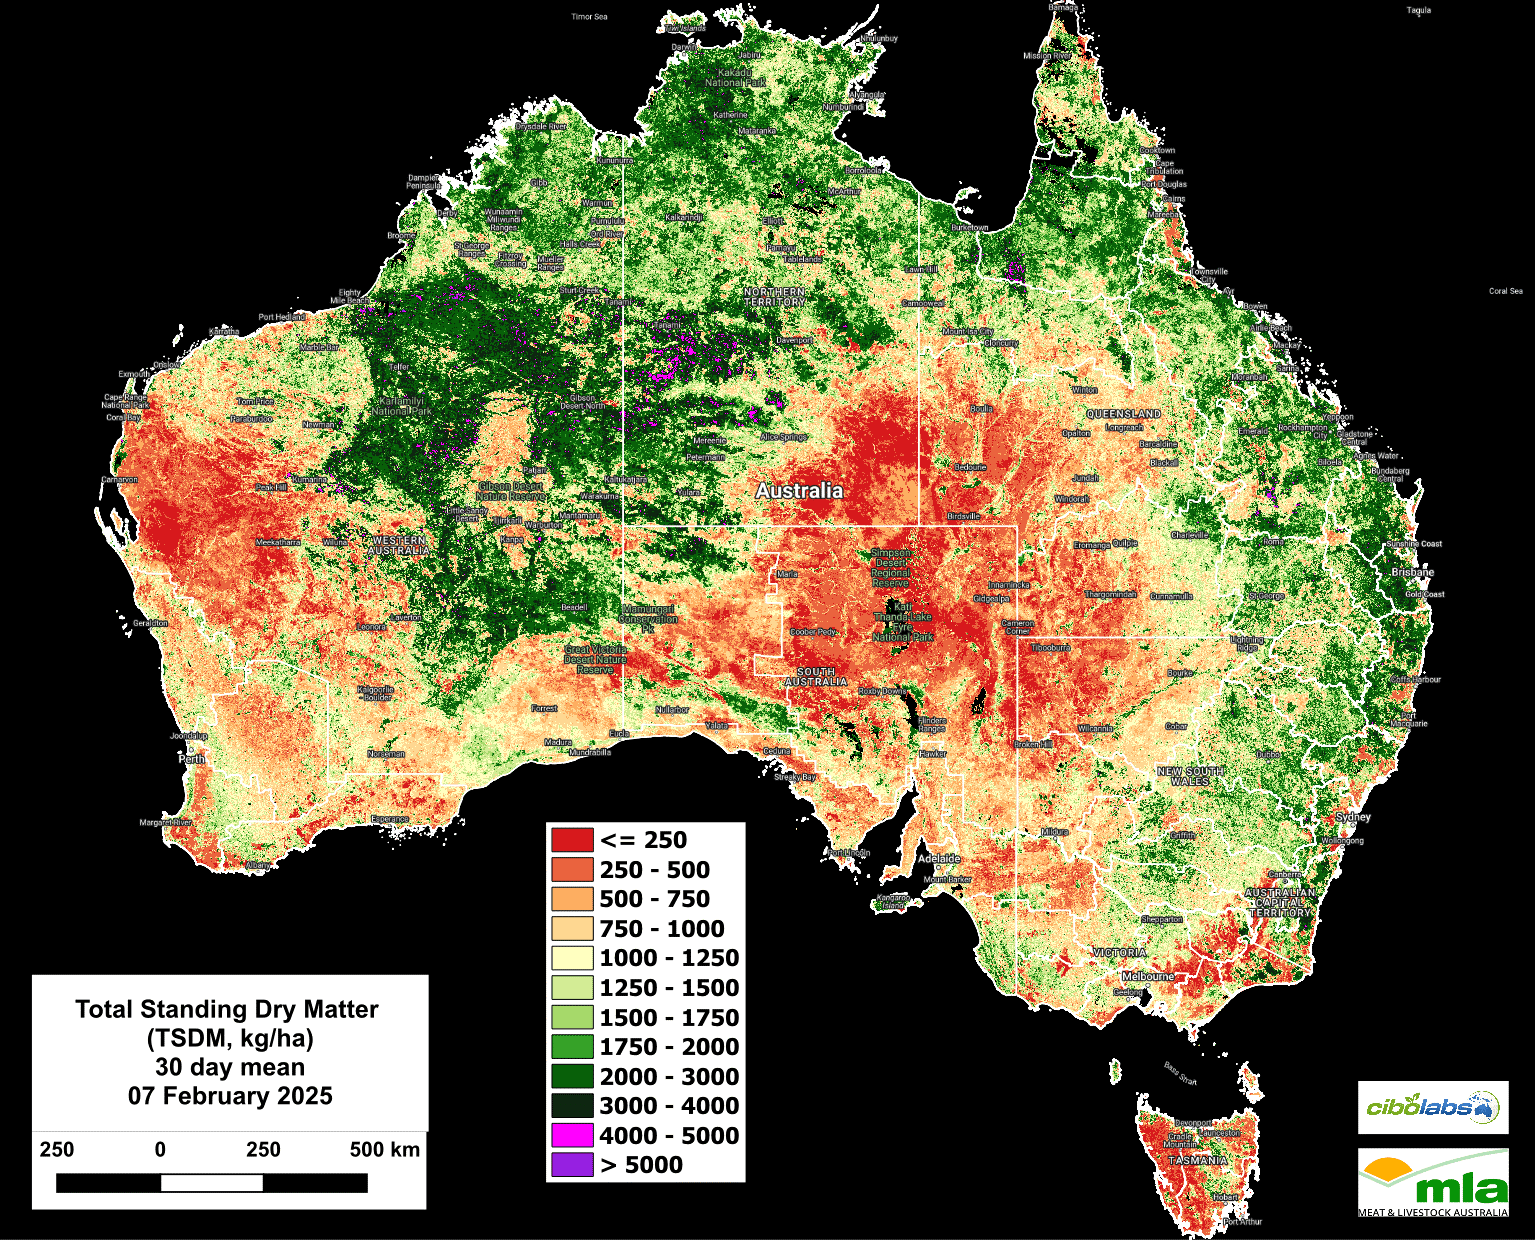
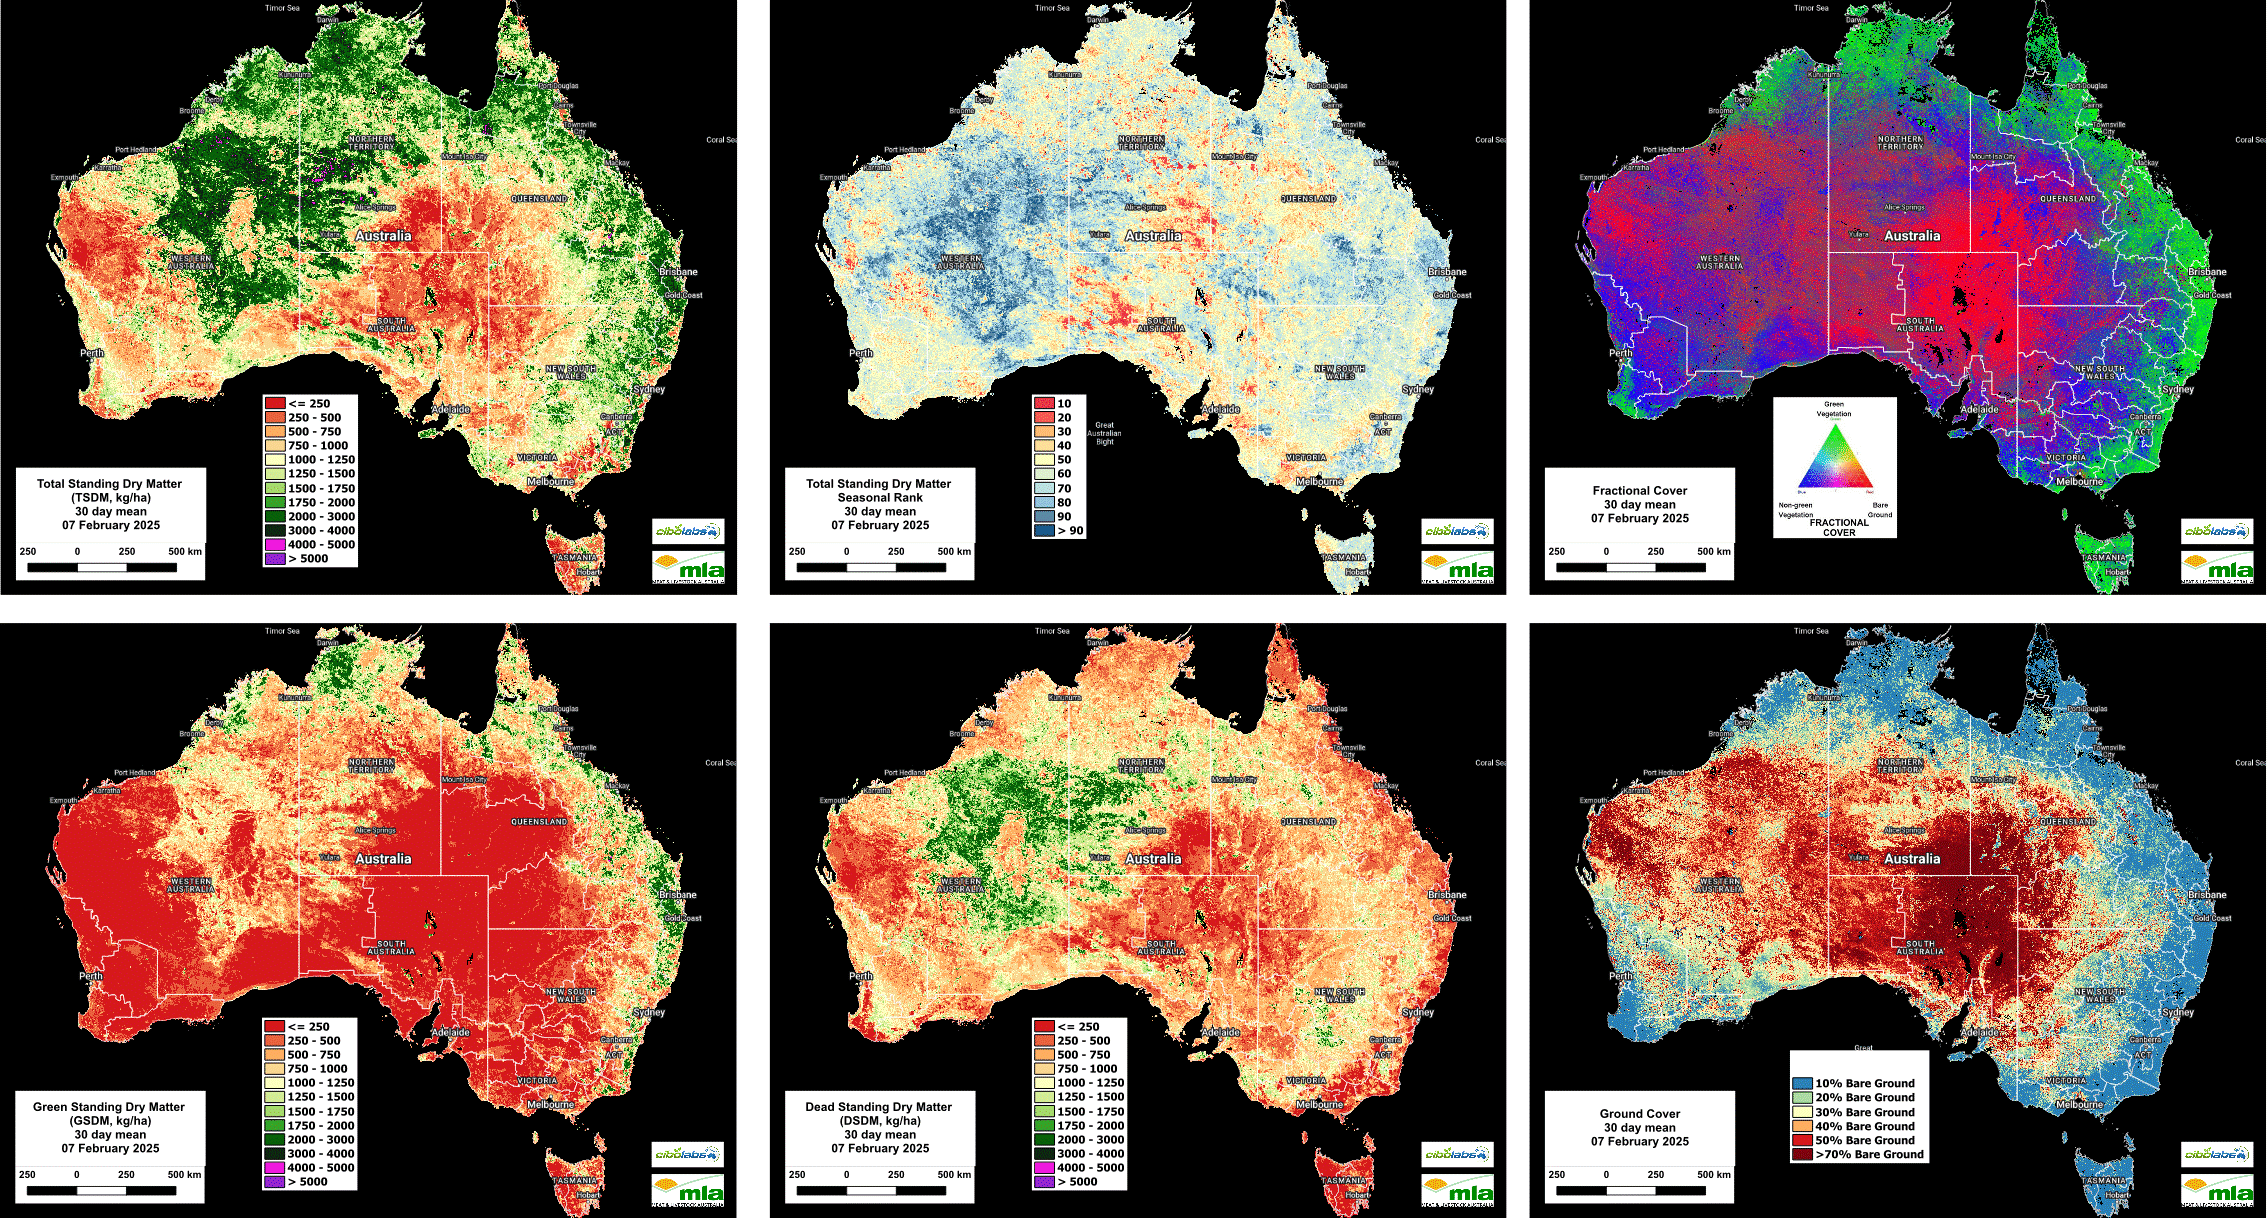
Image 1 – Total standing dry matter (Kg/Ha)
The total standing dry matter (TSDM) maps for early February 2025 show a mix of improvements and ongoing deficits:
- Eastern Australia: Rainfall has increased biomass in Queensland and New South Wales, with grazing regions exceeding 1250-1500 kg/DM/ha. Northern Queensland and the Top End, including Charters Towers, Cooktown and Katherine now exceed 2000 kg/DM/ha. Some areas in northern Queensland show bare ground increases due to uneven rainfall as the result of storms associated with the late wet season.
- South-western Western Australia: Inland areas remain below 750 kg/DM/ha with little improvement. Coastal areas, including Esperance and Albany, show some vegetation recovery from localized rainfall, but inland drying trends are persisting.
- Central and northern Australia: Rainfall has improved biomass in the Top End and northern Queensland, with some areas, including Cooktown and Georgetown, exceeding 1500 kg/DM/ha. Central Australia remains largely dry, with most regions below 500 kg/DM/ha.
- Western Victoria and south-eastern South Australia: Moderate improvements are seen in areas like Hamilton and Horsham, with biomass increasing from 750-1250 kg/DM/ha to 1250-1500 kg/DM/ha. South-eastern South Australia, including Mount Gambier and Naracoorte, also shows further biomass gains.
- South-eastern Australia: Above average rainfall has resulted in biomass increases across Victoria, Tasmania, and south-eastern New South Wales. Gippsland, the southern tablelands, and north-eastern Tasmania are now in the 1250-2000 kg/DM/ha range, with some areas in Tasmania exceeding 3000 kg/DM/ha.
Decile rankings and seasonal comparisons
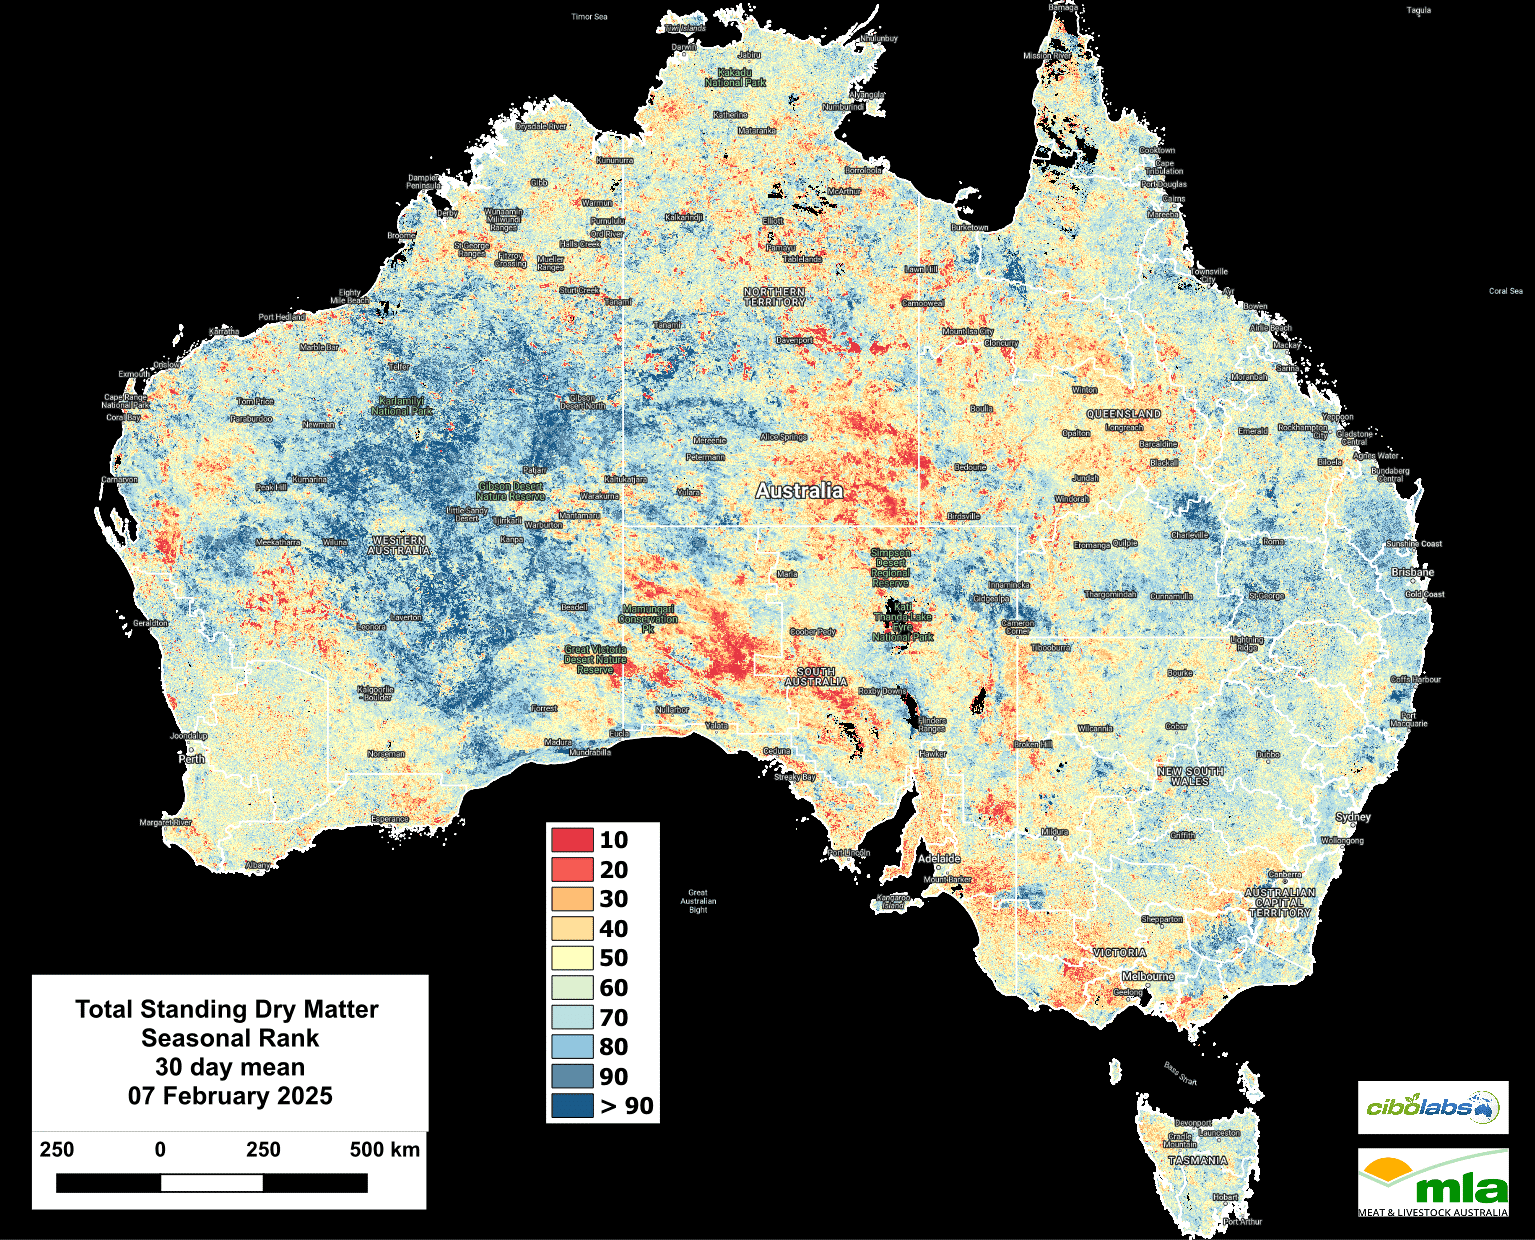
Image 2 – Seasonal comparison total standing dry matter
The TSDM seasonal rank maps, comparing December 2024 to February 2025 with the past eight years, indicate:
- South-eastern Australia: Biomass levels continue to improve, particularly in south-west Victoria, where many areas are now in the 70-90 decile range, with pockets exceeding the 90th percentile.
- South Australia: The south-east regions align with Victoria’s improvements, however much of the interior remains in lower deciles (10-30) due to limited rainfall and the ongoing impact of drought on the feedbase.
- Central Australia: Large areas remain in the lowest deciles (<10), though small pockets in the north have shifted into the 20-30 range.
- Northern Australia: Rainfall has led to improvements, with many areas moving into mid-to-high deciles (50-80).
- South-western Western Australia: Vegetation has declined further, with many inland and coastal areas slipping into the lowest deciles (<20).
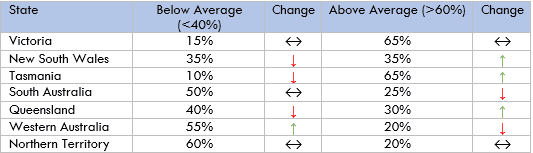
Proportion of below, and above average decile areas by state
Active plant growth: fractional cover insights
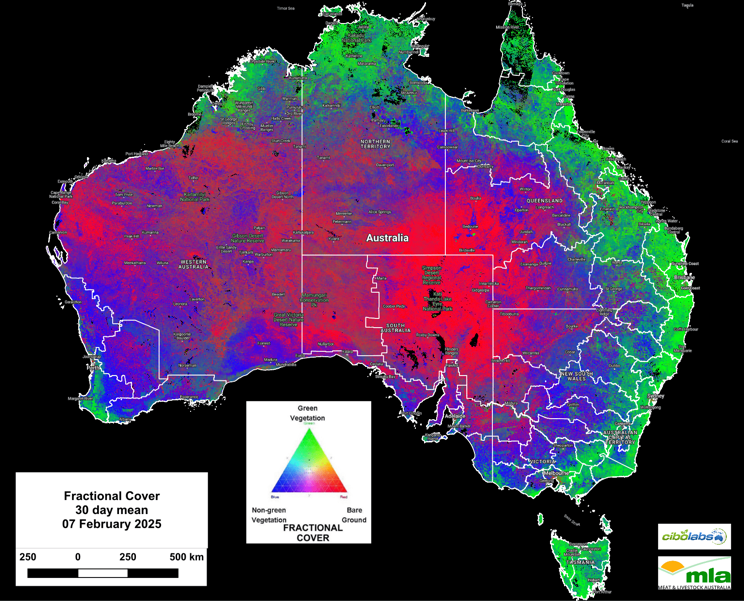
Image 3 – Fractional Cover
Fractional cover data from mid-December 2024 to early February 2025 shows:
- Eastern Australia: Growth (photosynthetic activity) continues to expand across New South Wales, Victoria, and eastern Queensland. South-west Victoria has seen a further increase in activity, reflecting the impact of rainfall in some areas.
- South Australia: South-eastern regions show improvement, but the interior remains dominated by non-green vegetation and bare ground.
- Northern Australia: Photosynthetic activity has expanded further in northern Queensland and the Top End, with active vegetation growth responding to recent rainfall.
- South-western Western Australia: Limited improvement inland, where non-green vegetation and bare ground remain dominant.
- Central Australia: Minimal vegetation activity persists, with widespread bare ground and low total standing dry matter.
Green standing dry matter (GSDM): vegetation recovery disparities
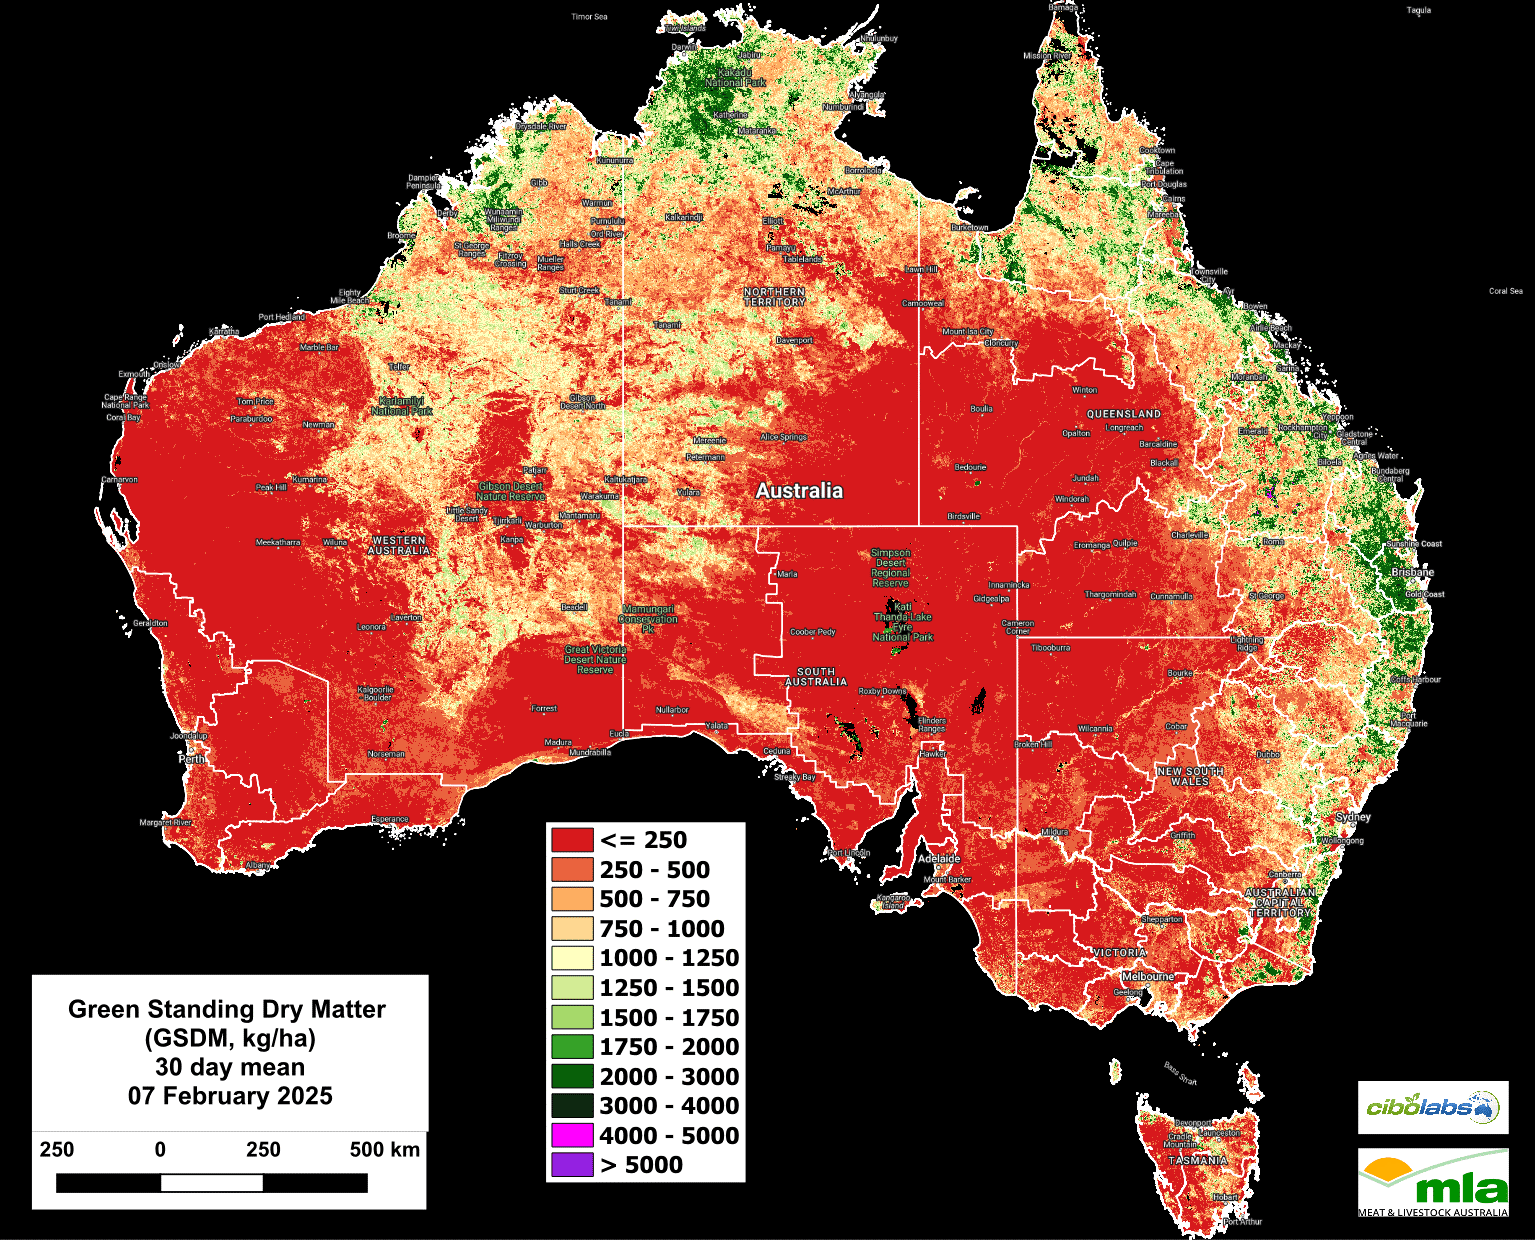
Image 4 – Green standing dry matter
The GSDM maps for mid-December 2024 to early February 2025 show the national variation:
- South-eastern Australia: Increases in green biomass are evident across eastern New South Wales, Victoria, and Tasmania, particularly in Wagga Wagga, Albury, Bendigo, and Launceston, with higher green biomass levels (1000-1750 kg/DM/ha). South-west Victoria, including Hamilton and Warrnambool, now exceeds 3000 kg/DM/ha in some pockets, reinforcing strong recovery trends from continued rainfall. South-eastern Queensland, particularly around Toowoomba and Warwick, have continued to increase, with many areas now reaching 1750-2500 kg/DM/ha.
- Northern Australia: Marked increases in green biomass are observed across northern Queensland and the Top End, particularly around Charters Towers, Longreach and Katherine, with large areas now reaching 1250-2000 kg/DM/ha. However, rainfall distribution remains inconsistent, leaving some areas, such as Cloncurry and Julia Creek, still below 750 kg/DM/ha.
- South-western Western Australia: Minimal biomass recovery continues, with most inland areas, including Merredin and Southern Cross, remaining below 500 kg/DM/ha. Coastal zones, such as Albany and Esperance have shown slight gains, but dry conditions persist inland, keeping many regions at critically low levels (<250 kg/DM/ha).
- Central Australia: Very little change in biomass levels, with widespread areas, including Alice Springs, Tennant Creek, and Birdsville, remaining below 250 kg/DM/ha. Rainfall remains insufficient for significant recovery, maintaining severe feed shortages.
- Tasmania and Southeastern South Australia: Steady improvements in biomass levels, with localized pockets, including Hobart, Devonport, and Mount Gambier, reaching 1500–2000 kg/DM/ha. Some areas previously in the lower range (750–1250 kg/DM/ha), such as Kingston SE and Strathalbyn, have seen gains, improving grazing potential.
Dead standing dry matter (DSDM): variability across regions
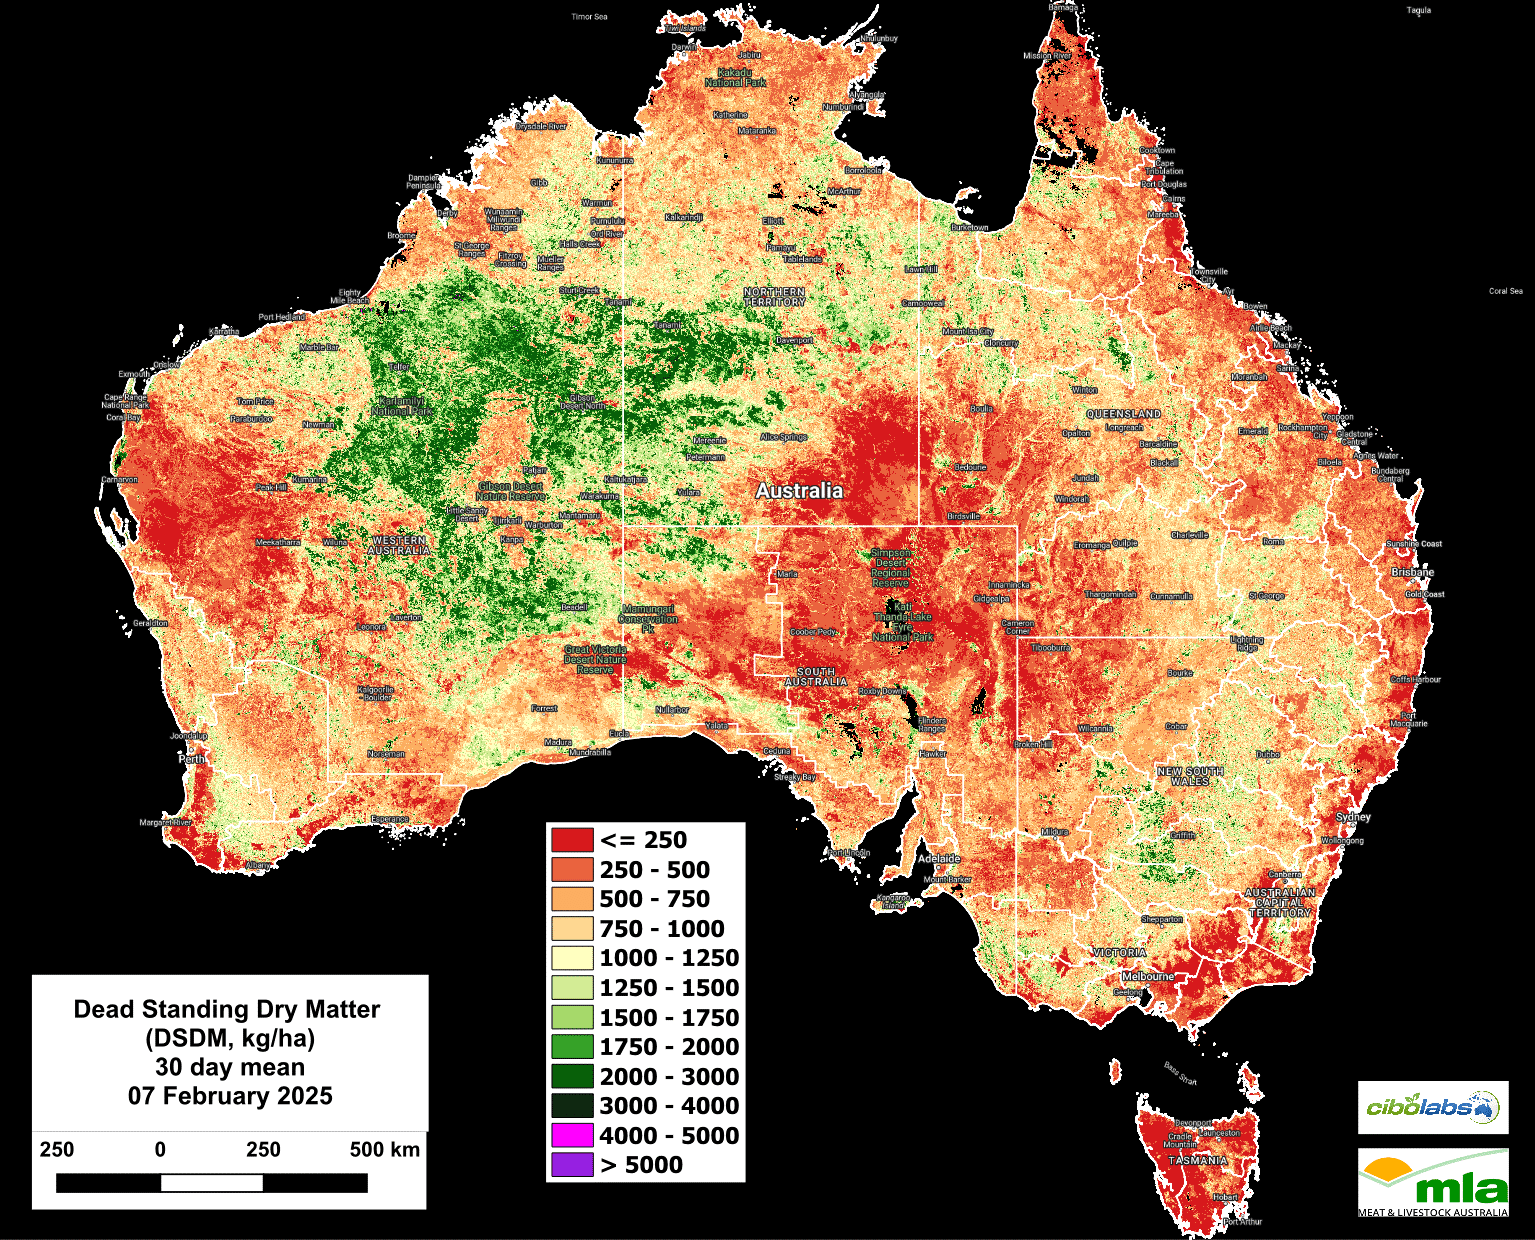
Image 5 – Dead standing dry matter
The DSDM maps for mid-December 2024 to early February 2025 show:
- Northern Australia: Central and northern Queensland, including Charters Towers, Longreach, and Richmond, experienced a further reduction in dead biomass, with levels dropping from 750-2000 kg/DM/ha to 250-750 kg/DM/ha. This transition reflects recent rainfall boosting green biomass, improving feed quality. However, patches of residual dead biomass in areas like Julia Creek and Cloncurry could still pose digestibility challenges for livestock.
- Southern States (Victoria, Tasmania, South Australia): Dead biomass remains sparse (<750 kg/DM/ha) across much of Victoria, Tasmania, and south-eastern South Australia, suggesting ongoing vegetation turnover and recovery. South-west Victoria (Hamilton, Warrnambool) and south-eastern South Australia (Mount Gambier, Naracoorte) are seeing increased green biomass, improving livestock feed quality. However, residual dead biomass is noticeable in drier pockets, including the Wimmera and Eyre Peninsula.
- Central Australia: Dead biomass remains critically low (≤ 250 kg/DM/ha) across Alice Springs, Tennant Creek and Oodnadatta, reflecting persistent arid conditions and minimal plant accumulation.
- South-western Western Australia: Localized increases in dead biomass (500-1000 kg/DM/ha) are evident around Merredin, Katanning and Esperance, reflecting ongoing dry conditions and slow recovery.
- Western and northern Western Australia: Residual dead biomass (750-1500 kg/DM/ha) remains in scattered pockets around Meekatharra, Broome, and Fitzroy Crossing, indicating leftover plant
Ground cover contrasts
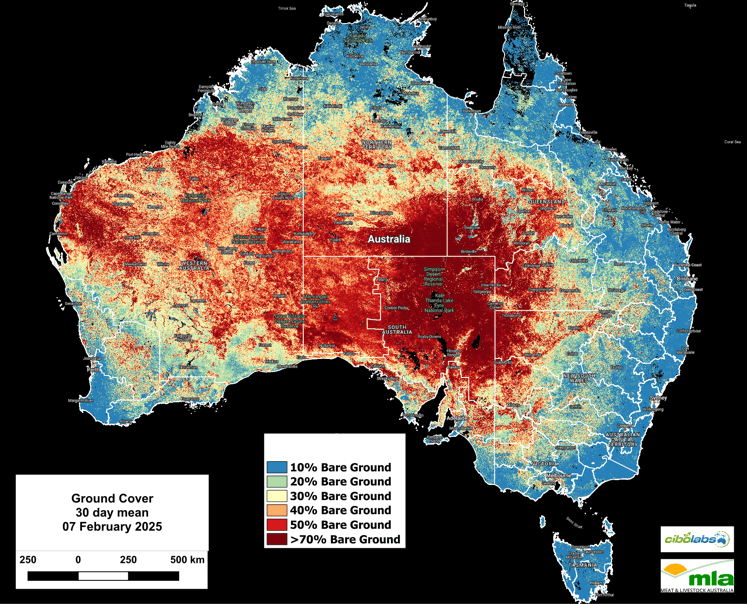
Image 6 – Ground cover
The ground cover maps for mid-December 2024 to early February 2025 highlight shifts in vegetation cover and bare ground expansion:
- Central Australia: Extensive areas of bare ground persist, particularly around Alice Springs, Tennant Creek and Oodnadatta, with large regions continuing to exceed 50-70 percent bare ground.
- Western Australia: Bare ground expansion remains significant, particularly in the interior and northern regions, including Meekatharra, Newman, and Halls Creek. Many areas now record 50-70pc bare ground, with some pockets exceeding 70%, reflecting limited rainfall and persistent dry conditions. The south-west, including Albany and Esperance, have retained more vegetation cover, but inland regions have seen worsening trends.
- Northern Australia: Ground cover has remained relatively stable, but localized increases in bare ground are evident in Charters Towers, Katherine, and Julia Creek. Some regions have shifted from 20-30pc to 30-40pc bare ground, driven by drying trends where recent rainfall has been insufficient.
- South-eastern Australia: Dense vegetation cover dominates Victoria, New South Wales, and south-eastern Queensland, with most areas maintaining <20pc bare ground. Rainfall-driven recovery has helped maintain strong ground cover in Wagga Wagga, Albury, Toowoomba, and Goulburn.
- South-western Western Australia: Drying conditions have increased bare ground, with regions shifting from 20-30pc to 40-50pc bare ground, particularly in Merredin, Narrogin and Katanning. Limited rainfall in inland areas has challenged vegetation retention, making ground cover maintenance increasingly difficult.
For more localised information including regional level overviews, users are encouraged to explore the Cibo Labs regional comparison. This tool provides regional data that may show the impact of localised weather or fire events. A further level of detail for individual properties is available for users who have created an Australian Feedbase Monitor account, which can be accessed both through the MyMLA portal or through the Cibo Labs website. These tools enable land managers to make data-informed decisions tailored to their unique feedbase conditions and needs.
The Cibo Labs National Comparison can be used to freely access these layers (https://www.cibolabs.com.au/products/national-comparsion/) to view the most recent images from a national, state or catchment level.
This tool can complement the Australian Feedbase Monitor which can also be created within the Cibo Labs Web Site www.cibolabs.com.au
HAVE YOUR SAY