TOTAL standing dry matter conditions in April reflected the seasonal events that have dominated recent months.
Northern and eastern Australia show high levels of growth and biomass accumulation, a result of a strong wet season and high levels of rainfall along the eastern seaboard.
However, in Western Australia, drought conditions in the south-west are extending eastward towards the Nullarbor and north into the Pilbara reflecting the low rainfall and high temperatures that have characterised the summer and autumn period.
Imagery and analysis provided by CiboLabs
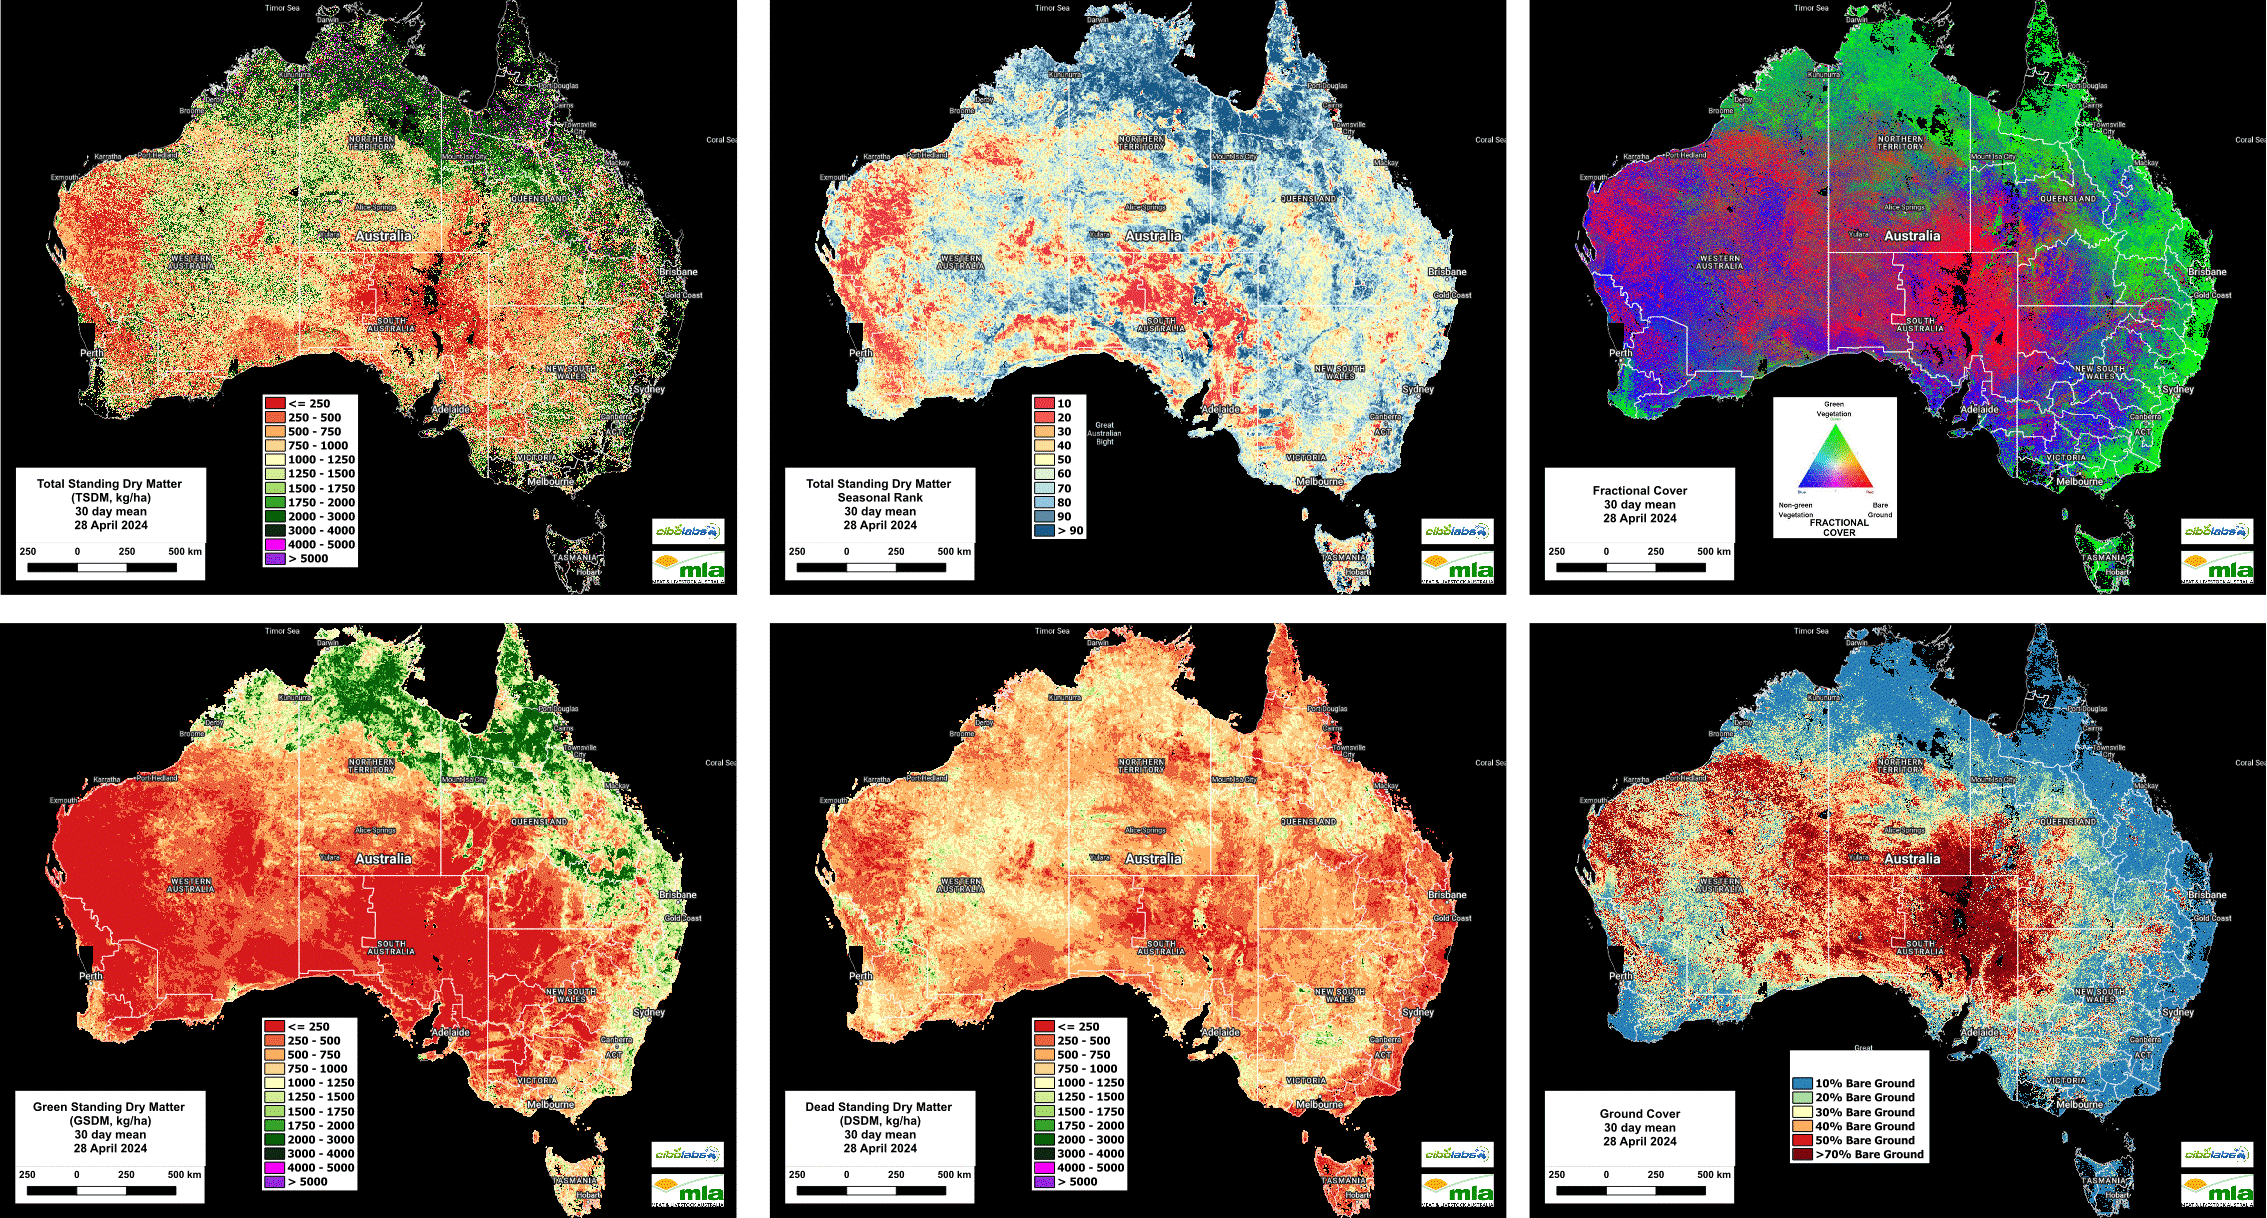
Total Standing Dry Matter
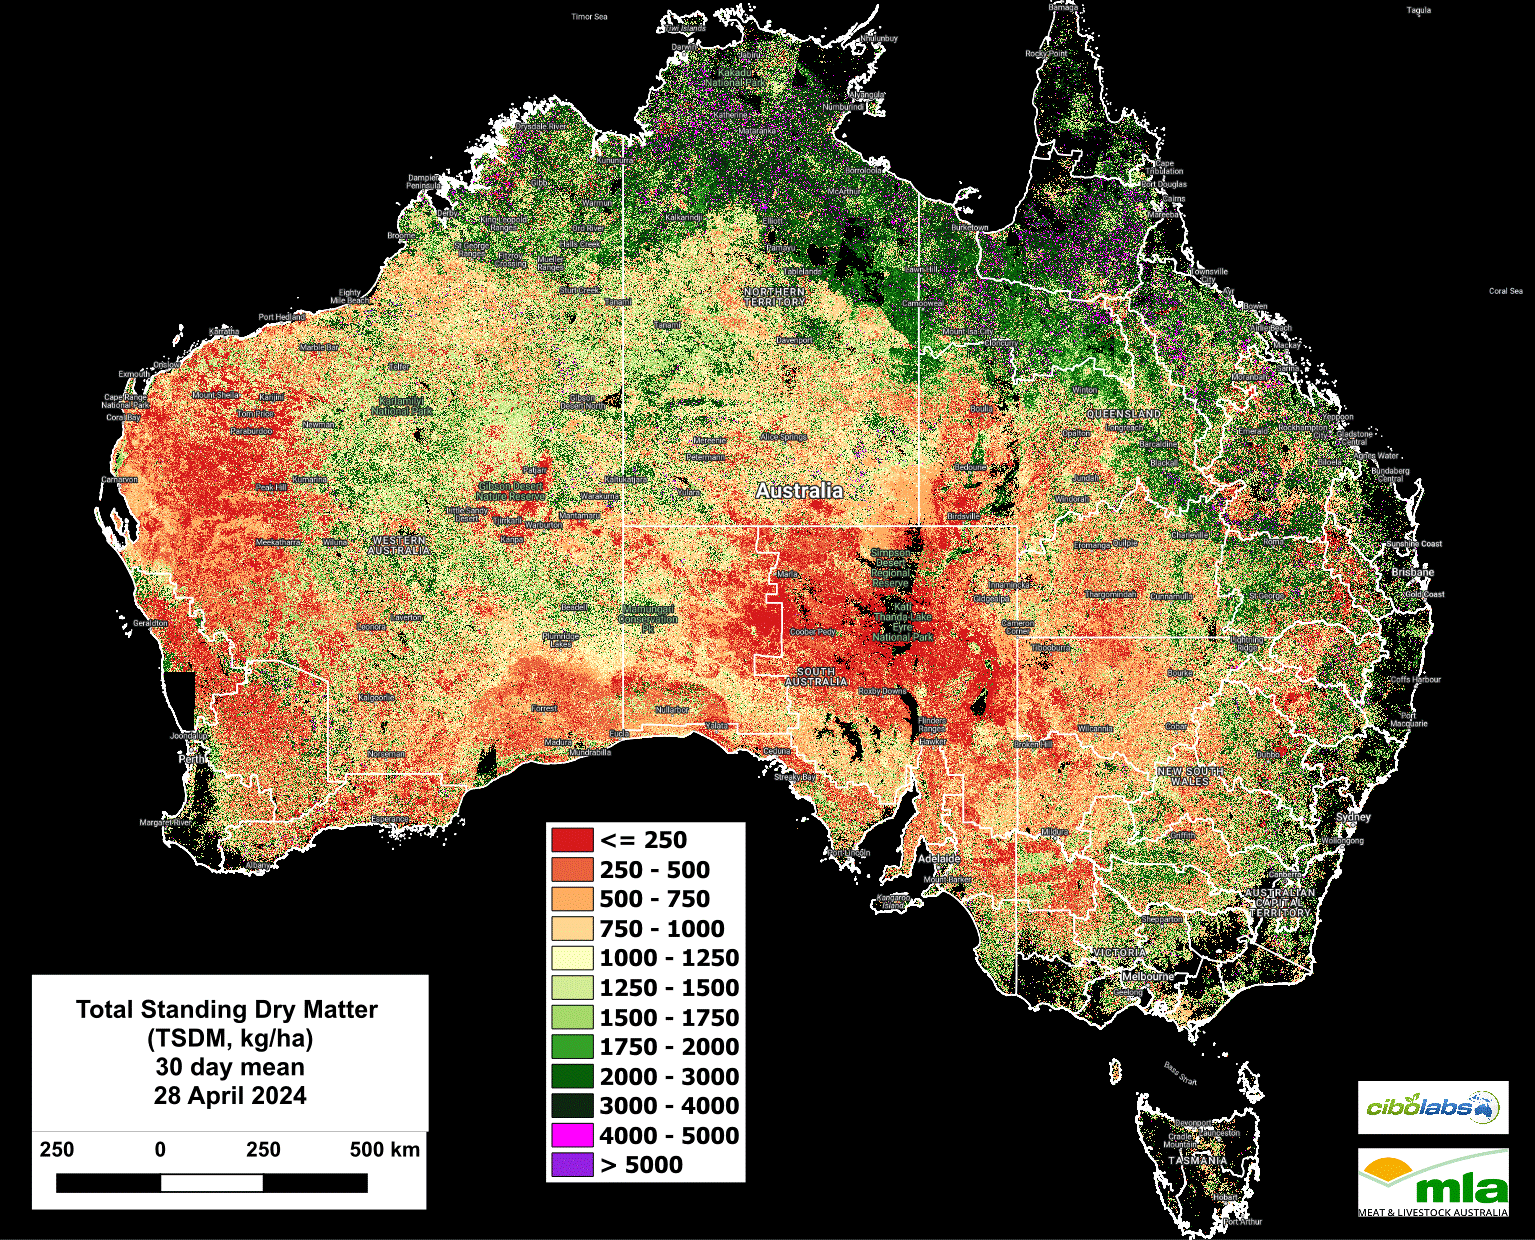
Image 1 – Total Standing Dry Matter (Kg/Ha)
The National TSDM image published on 28th of April, highlights the very high biomass levels extending from the Kimberley, across Northern Australia and extending south-east from Mount Isa through central Queensland.
Conditions remain average to good in New South Wales and decline significantly in Tasmania and the Bass strait islands. Further west the extent of areas with low levels of TSDM is expanding in South Australia and Western Australia.
Seasonal Comparison Total Standing Dry Matter
The Seasonal Ranking (based on the past 8-year average Figure 2) reflects the above average conditions much of Queensland, the Northern Territory and western NSW are experiencing.
More average conditions exist in eastern NSW and parts of Victoria.
However, much of the southern states as well as the western states continue to have below average levels of TSDM for this time of year.
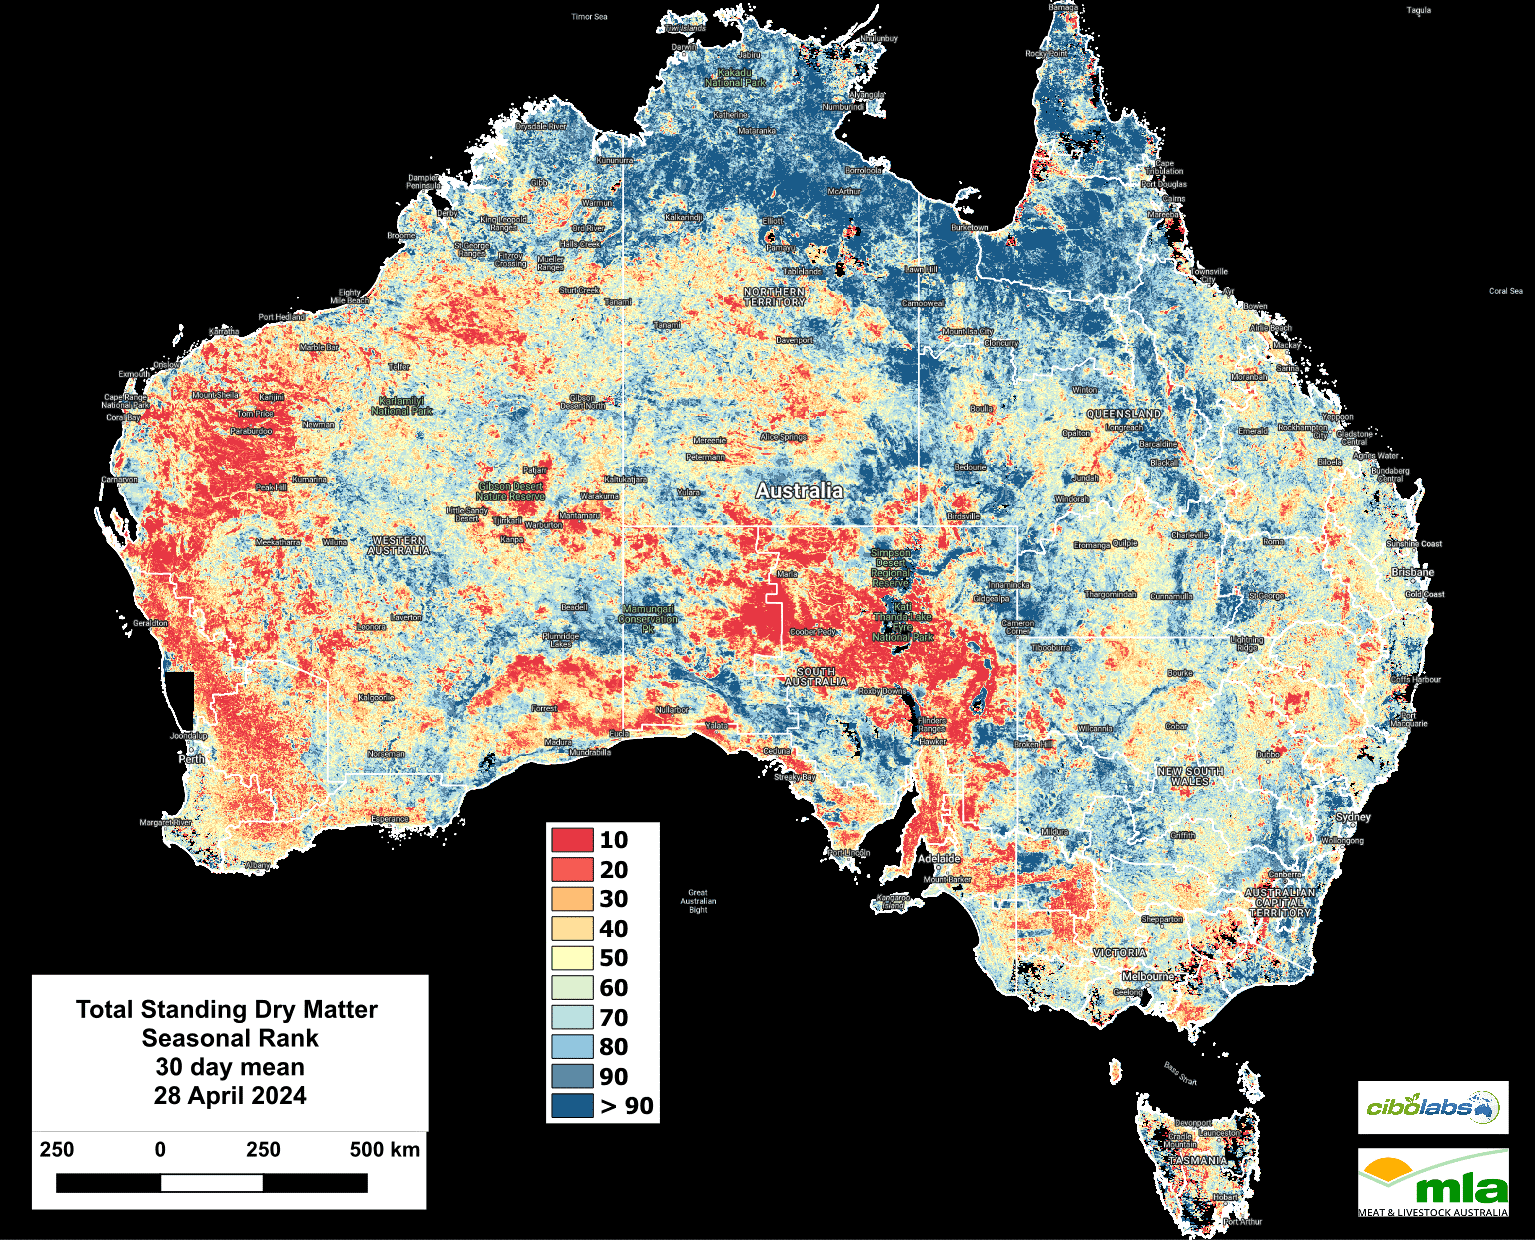
Fractional Cover (Growth)
The extent of growth events in northern Australia is reflected in the Fractional Cover images. (Image 3)
Recent rainfall across the eastern half of Queensland and NSW as well as the response to flood events can be seen in the expansion of areas shaded green.
Some growth has occurred along the coast of southwest Western Australia; however, significant rain is needed to extend inland in order to promote noticeable biomass change.
Green Total Standing Dry Matter
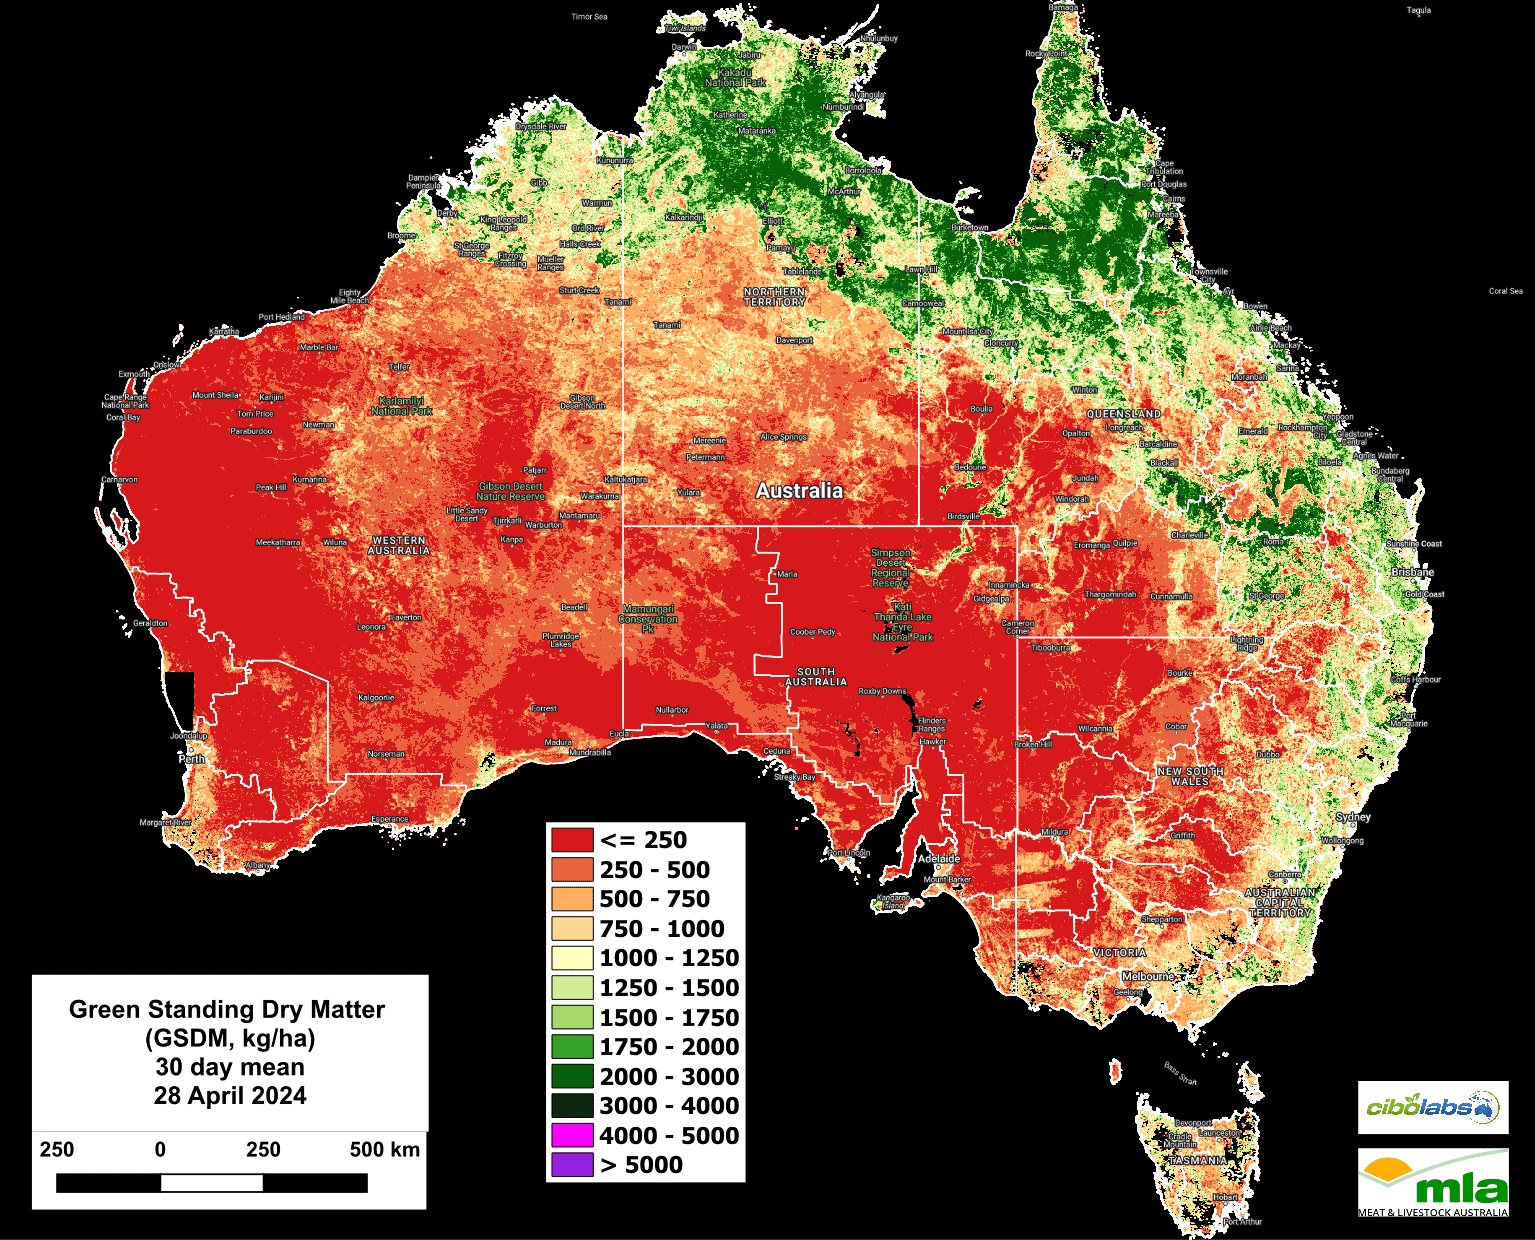
Image 4 – Green Standing Dry Matter
Green standing dry matter levels (Image 4) reflect the growth events noted in the Fractional Cover layer.
High levels of biomass exist along the major waterways as well as in the north and central Queensland.
Eastern NSW is also now seeing good levels of Green Standing Material.
Dead Standing Dry Matter
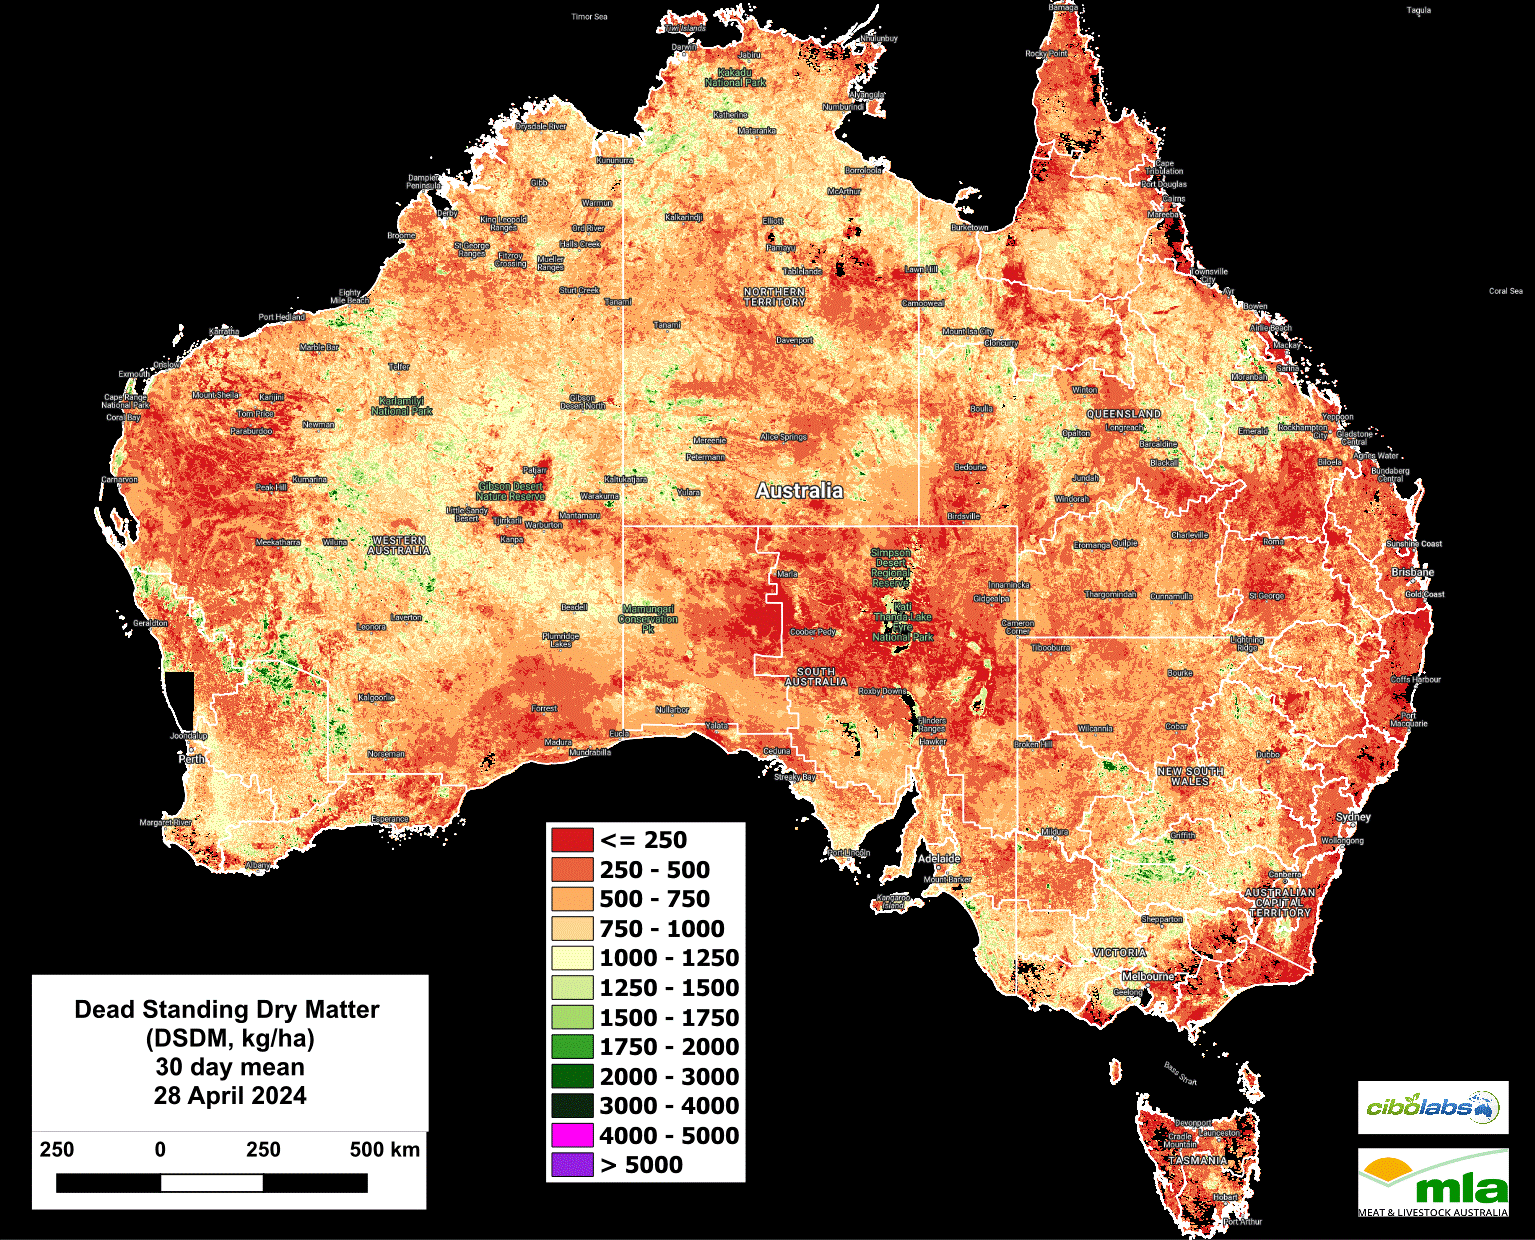
Image 5 – Dead Standing Dry Matter
Dead Standing Dry Matter imagery (Image 5) suggests that while there are several areas where dead material is exceeding 1500kg Dry Matter /Ha in northern Australia and central Queensland, these are limited in scale.
This suggests the season is still supporting active growth with plants continuing to grow and have yet to reach maturity and die.
Monthly Ground Cover levels
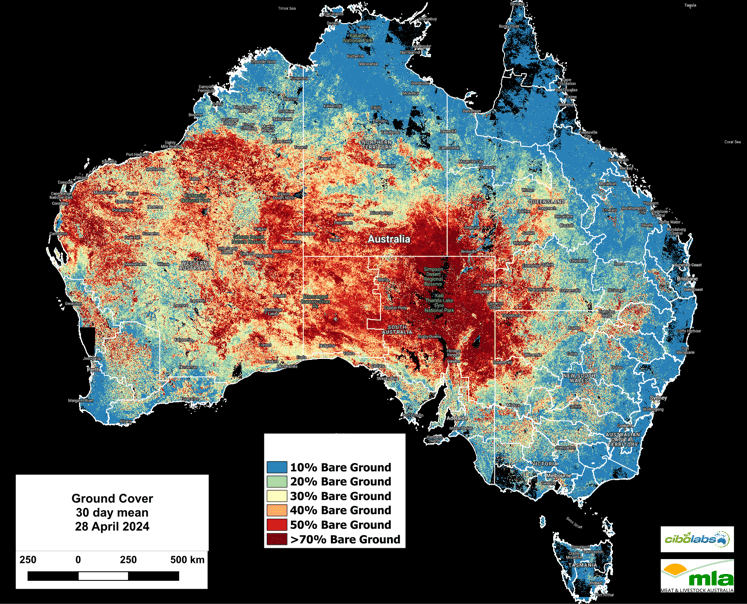
Image 6 – Ground Cover
Ground cover levels remain largely similar to previous observations with no significant alternations noted. (Image 6)
For more localised information including regional level overviews, users are encouraged to explore the Cibo Labs Regional Comparison. This tool provides regional data that may show the impact of localised weather or fire events. A further level of detail for individual properties is available for users who have created an Australian Feedbase Monitor account, which can be accessed both through the MyMLA portal or through the Cibo Labs website.
The Cibo Labs National Comparison can be used to freely access these layers (https://www.cibolabs.com.au/products/national-comparsion/) to view the most recent images from a national, state or catchment level.
This tool can complement the Australian Feedbase Monitor which can also be created within the Cibo Labs Web Site www.cibolabs.com.au
HAVE YOUR SAY