IT’S perhaps a little easy to miss, but one of the most important features of the Meat Industry Strategic Plan 2020 document launched yesterday can be found just inside the publication’s back cover.
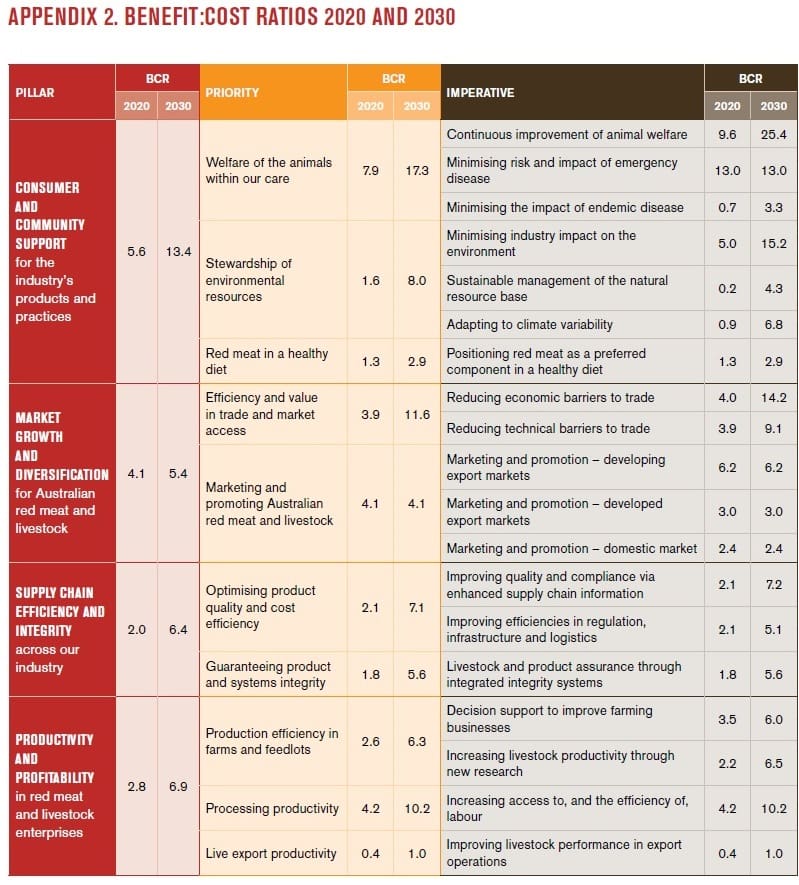
Published below is the document’s ‘Appendix 2’, a Benefit:Cost analysis, which attempts to provide a guide to where the red meat industry is likely to capture the best ‘bang for its buck’ in future investment in marketing, market development and R&D.
It’s the first time that any of the past four MISP documents dating back 20 years or more have made any serious attempt to define the likely industry impact in this way – helping define key performance indicators and benchmarks, and quantifying the potential in each space in investing for optimum returns to the industry.
The economic modelling for the table was carried out by former MLA senior economist, Dr Peter Barnard, working on secondment with economic consultants, Centre for International Economics. CIE’s economic models, updated for this project and application, were used to deliver the forecasts.
In essence, the MISP 2020 document, including the benefit:cost analysis, provides a roadmap and a set of tools to assist peak councils and service delivery companies to allocate spending, whether it be in R&D, marketing or market development.
One of the key messages delivered by RMAC chairman Ross Keane at yesterday’s MISP launch (click here to access yesterday’s launch story) was that if the industry is successful in addressing the opportunities outlined in the table below, it could add almost $7 billion to the industry’s bottom line by 2030. Conversely, to ignore them and do nothing could cost the industry $6 billion over the same period.
“Realising the opportunities framed within MISP 2020 represents the most valuable return on investment we can offer to our industry, and the community more broadly,” Mr Keane said.
“For the industry organisations responsible for leading and funding this investment, and for the industry’s co-investment partners, success will require an on-going focus on performance,” he said.
The Benefit:Cost Ratio (CBR) refers to the estimated dollars returned to industry, for every dollar spent in each subject area.
The table below (click on image for a larger view) clearly shows that ‘big-ticket’ industry challenges like animal welfare, minimising risk and impact of exotic disease, environmental management (especially longer-term), efficiency and value in trade and market access, and processing productivity will be the big drivers of opportunity benefit, going forward.
Understanding the table
The Benefit:Cost table published above includes two horizons: the five-year period between now and 2020, and a longer 15-year interval out to 2030.
It divides each of the four MISP 2020 subject ‘pillars’ into a series of ‘priorities’ (yellow column), and key ‘imperatives’ within each of those priorities (chocolate column).
Using just the first of the four pillars as an example, it can be seen that:
- The “Consumer and Community Support for the industry’s products and practices” pillar shows that the overall BCR in this area out to 2020 is estimated at 5.6:1 over the next five years, before growing to 13.4:1 over the 15-year timeframe.
- Within the Consumer and Community Support pillar, the first priority – “Welfare of the Animals within our care” – has a 7.9:1 BCR out to 2020, growing to 17.3:1 over 15 years.
- On the right hand side, under the ‘imperatives’ column, it can be seen that ‘continuous improvement of animal welfare’ has an expected payback of 9.6:1 by 2020, growing to a massive 25:1 by 2030.
One of the important points exposed in the table is that the industry may have to spread its expenditure reasonably widely, because to simply ignore some elements would invite disaster. Thus it is perhaps more about helping ‘prioritise’ those investments where the report provides greatest guidance for peak councils and service delivery companies.
On separate pages in the MISP 2020 report (click here to access), there are separate ‘downside risk’ and ‘upside opportunity’ assessments over changes in net income within each priority area.


HAVE YOUR SAY