IT was another volatile week in the wool spot auction and forward markets, with supply/demand flows dominating direction.
The week began with forward levels lifting 50 cents off the back of positive signals coming out of China.
This move was franked by the auction on Wednesday, with the Eastern Market Indicator rising 61 cents.
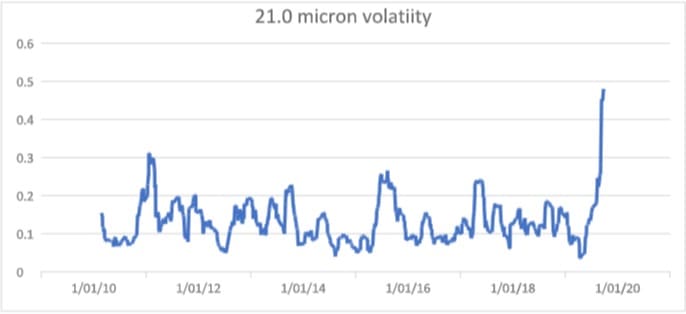
Forward bidding remained strong on Thursday and trades into the summer for 19 micron wool peaked 130 cents above last week, with November trading to 1850 cents. The fickle and unpredictable nature of the market kicked in with prices falling away into the close on the forwards and the auction market in the west. Both Merino indicators (19 and 21 micron) traded 50 cents below their earlier peaks. The unprecedented volatility, as illustrated by the graph below, indicates the need to adopt a risk strategy.

Both buyers and sellers setting hedge targets have benefited from the whipsaw nature of the market.
The setting of targets is difficult enough in this environment. Trying to predict the direction and momentum of the market with volatility over 40 percent is fraught with danger. Targets need to be set with consideration to the volume at risk, the individual’s appetite for risk, cost of production and desired margin. Most growers hedging at present are looking at step-up program combining price (margin), volume and timing targets. Their aim is to achieve an increased percentage of coverage over time should certain margin targets be achieved. The cap on the percentage cover they target relates to their appetite risk and their overall view of the market.
Hopefully, follow up demand will flow through next week and we will see some stability return to the market.
Indicative forward levels
19 micron 21 micron 28 micron
October 1800 cents 1750 cents 920 cents
November 1800 cents 1740 cents 920 cents
December 1800 cents 1730 cents 920 cents
January/March 1780 cents 1720 cents 860 cents
April/June 1760 cents 1700 cents 830 cents
Trading levels
October 19 micron 1790/1830 cents 23 tonnes
October 21 micron 1750 cents 5 tonnes
November 19 micron 1800/1850 cents 14.5 tonnes
January 2020 19 micron 1755 cents 3 tonnes
February 2020 19 micron 1740/1800 cents 7.5 tonnes
April 2020 18 micron 1800 cents 2.5 tonnes
April 2020 19 micron 1800 cents 2 tonnes
Total 57 tonnes

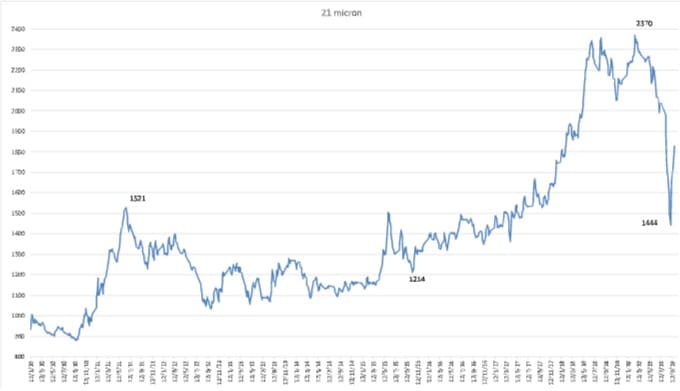
Updated 21 micron price chart. The 21 micron index has recovered 384 cents from its fall of 926 cents from the peak of 2370 cents to
1444 cents. It would be expected that some resistance will be encountered at 1820 cents.

HAVE YOUR SAY