FORWARD and spot wool trading platforms continued to struggle with the constant market volatility this week.
The forward 19 micron contract traded at 1770 cents for November early in the week.
With the cash market having risen 50 cents from 1730 cents to 1780 cents the previous week, indications were that the spot auction should be well-supported.
Some light volumes were traded around cash on the 21 and 28 micron contracts. With sellers retreating and no serious follow through from the buy side, volume dried up ahead of spot auction.
Another reversal of fortune saw most Merino types lose 30 to 40 cents Wednesday. Buying interest subsided and sellers remained off the pace.
We have seen most phenomena in the market in the last year, but not a significant fall only lasting a day. Sure, enough of the market found support, with Merino qualities rising 10 cents. The 19 micron November contract traded again at 1770 cents, back where we started the week.
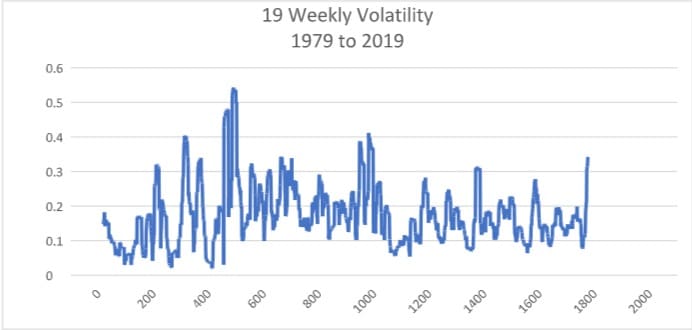
Volatility might be the friend of the speculator, but it is not the friend of the farmer. Studies have shown a strong negative correlation between volatility and farm incomes. Unfortunately, agriculture is the most volatile sector in the Australian economy.
Recently, market commentators have put forward reasons for the collapse in wool prices. Most reasons are logical and some say predictable. All are viewed with the advantage of hindsight.
Forward traded volumes suggest that it was predictable to only few, if any. In excess of 50 contracts covering around 300 tonnes have been contracted for 2020 and 2021. Almost all are between processors and growers that value certainty and margin management.
Indicative trading levels for next week.
19 micron 21 micron
October 1770 cents 1680 cents
November 1770 cents 1670 cents
December 1730 cents 1640 cents
January/March 1700 cents 1600 cents
April/June 1700 cents 1600 cents
Trade summary
November 19 micron 1770 cents 10 tonnes
November 21 micron 1735 cents 5 tonnes
November 28 micron 910/935 cents 15 tonnes
Total 30 tonnes
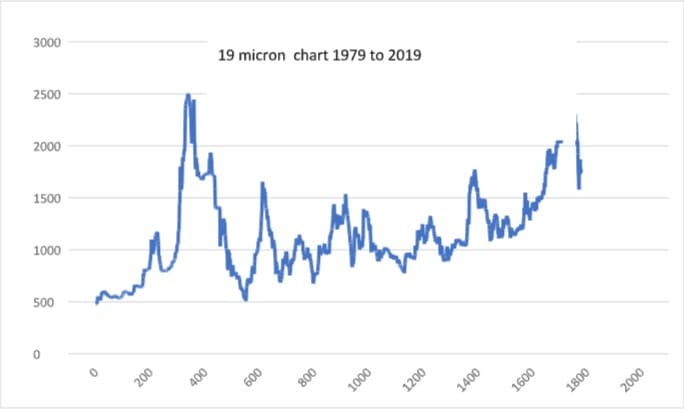
The long-term charts below track trends in price and volatility for the last forty years. How to develop a strategy to mitigate and smooth out returns is a challenge for the entire pipeline.


HAVE YOUR SAY