With large areas of Australia subject to drought declarations, including 80 percent of Queensland, the rainfall outlook for this spring and summer is taking on even greater importance than usual.
As much as climate scientist Dave McRae says he would like to be the bearer of good news, there is no sugar coating the fact that most climate models are pointing to a less than 30 percent chance of above average rainfall throughout eastern Australia this spring.
It is no secret we are again in the grip of a strong El Niño, with the current pattern emerging as the strongest since the 1997–98 event. This is reflected by strongly negative SOI values, sea surface temperatures in the central and eastern Pacific well above the El Niño threshold and weak south east trade winds.
El Niño events usually mean a drier than average winter and spring and a later start to the summer wet season. However, Mr McRae stresses, it is worth remembering that this does not necessarily mean there will be no rainfall.
“You can still get reasonable rainfall during El Nino events, but you just don’t expect big well above average or drought breaking rainfall during the middle of an El Nino. This is why we continue to recommend a cautious approach when considering property management decisions and the longer-term outlook. ”
One more positive factor present this year that was not present during previous major El Niño events such as 1982-83 is the existence of a warmer than normal pool of water off the Queensland-New South Wales coast.
The effect of warmer than normal ocean temperatures is a bit like the effect of a boiling kettle. The warmer the water, the more atmospheric moisture is produced, and the greater the opportunity there is for rainfall.
In a typical El Niño year, we normally have cooler than normal ocean temperatures around Australia, and therefore less moisture inflow across the continent and less opportunity for rainfall.
“The large pool of warmer than normal ocean temperatures off the Queensland and NSW coast may explain why this El Niño hasn’t had the same impact for parts of eastern Queensland and NSW as previous ones have had,” Mr McRae told an audience at the recent Darling Downs Beef Xpo in Toowoomba.
Mr McRae, who works with the International Centre for Applied Climate Science at the University of Southern Queensland in Toowoomba, says some climate models are starting to point to a slight improvement in rainfall probabilities for eastern Australia during the second half of summer.
Here are some key factors Mr McRae says producers should look out for over the next few months:
Watch the MJO in the second half of September:
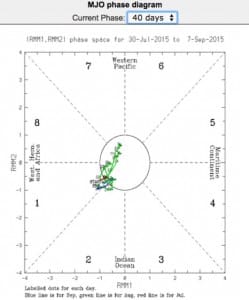
The Madden Julian Oscillation, or MJO is a band of low air pressure originating off the east coast of central Africa. It travels eastward across the Indian Ocean and northern Australia roughly every 30 to 65 days and can be used to indicate the timing of potential rainfall.
A spiderweb graph on the Bureau of Meteorology website allows anyone to track the path of the MJO on a daily basis. It looks like this:
The squiggly line is the actual track of the MJO. When it is inside the circle the pattern is very weak and unlikely to bring much rainfall.
What we want to see for northern and eastern Australia from mid-September, when the MJO is next due to cross our longitudes, is for the squiggly line to come out and away from the circle and increase in strength as it approaches the maritime continent on sectors four and five on the chart.
“Based on its current timing it would be reasonable to expect the next passage of the MJO during the second half of September. It will be interesting to watch it as it approaches Australia longitudes to see if it gains strength. This would help increase the likelihood of triggering some broad, widespread storm activity,” Mr McRae said.
You can monitor the MJO’s path on the BOM website here
Late summer should reveal the duration of this El Niño event
Current models suggest the El Niño is going to peak during December and January and then should slowly decay through to April. Typically El Nino and La Nina events usually peak during summer and break down during autumn and early winter.
Howeve, there is a risk, because the Sea Surface Temperatures underpinning this El Niño event are so much warmer than normal, that it could persist on after April.
Having multi-year El Niño events is not common, but certainly not unheard of. Recent examples include 1991 to 1995 and 1986 to 1988.
So the question is will the current El Niño persist on past April?
Mr McRae said that it is impossible to answer that question yet, but ocean temperatures and the SOI during late summer will provide a strong guide.
Why the SOI is important
The Southern Oscillation Index or SOI measures the barometric air pressure between Darwin and Tahiti. A good rule of thumb is that the SOI values remains strongly positive values we have more low pressure systems over Australia and therefore more opportunity for rainfall. On the other hand if SOI values remain consistently negative, we more high pressure systems. Of note is that monthly values of the SOI have been in negative territory since June 2014 – that is 14 straight months of negative monthly SOI values in a row.
Work on 70pc of historic rainfall, not long-term average
What is a reasonable rainfall figure to expect? Mr McRae encourages landholders to focus on what they receive in 70pc of years as opposed to their long-term rainfall average.
“Yes, it is a lower rainfall figure, but certainly it will take out the stress of saying I didn’t get my average rainfall. You get a much more realistic rainfall figure I think,” he said.
Using Jondaryan on the Darling Downs as an example, the area’s median rainfall for September, October and November is 145mm. But in seven out of 10 years under the same scenario they have received 80mm. That is why the “70pc” rule is considered a safer, more reliable figure to use.
Australian weather, thy name is variability
It will come as no surprise to anyone living and working in Australian agriculture that our rainfall is highly variable. However many may not realise just how much more variable our weather is compared to many of our agricultural competitors.
Australia has rainfall variability about twice as high as New Zealand, and variability pushing 2.5 to 3 times higher than many of key export competitors such as the United States, Russia and other parts of Europe.
The most variable rainfall zone in the most variable rainfall country is basically the region covering much of the NT and inland Queensland.
The least variable rainfall areas comprise the bottom parts of South Australia and Victoria, Tasmania and South West Western Australia.
“It doesn’t mean there are no droughts there, it just means that annual variability from one year to the next is much lower than it is in this part of the world (speaking from Toowoomba).”
The main cause of our rainfall and temperature variability is what happens in the Pacific Ocean. It is the largest body of water in the world, it drives the atmosphere above it, and it drives our background climate.
Measure rainfall from April to March basis
Another tip Mr McRae offered is for landholders to measure rainfall on an April to March basis, rather than from January to December.
The climate year effectively runs from autumn to autumn, which, as mentioned earlier, is the transition time for the onset of El Nino or La Nina events.
“Measuring rainfall from April to March fits in a lot better with our climate year,” Mr McRae said.
“Measuring it on a calendar year basis cuts our summer rainfall season in half.”


HAVE YOUR SAY