MERINO and crossbred wool prices behave as industrial commodities, rather than agricultural commodities, with prices determined in the main by macroeconomic cycles in the major economies of the world.
This means what happens in the economies of China, the USA and Europe is of great import to the prices we see paid at auction.
Wool is part of a much larger textile complex, with complimentary and competing relationships to other fibres. Wool itself is a complex mix of fibres ranging from 10 to 40 microns, used for a range of purposes from expensive apparel to carpet to insulation. As part of a larger textile complex, wool follows similar trends and cycles to other fibres such as cotton, polyester, viscose and acrylics, simply because they are responding to common macroeconomic signals.
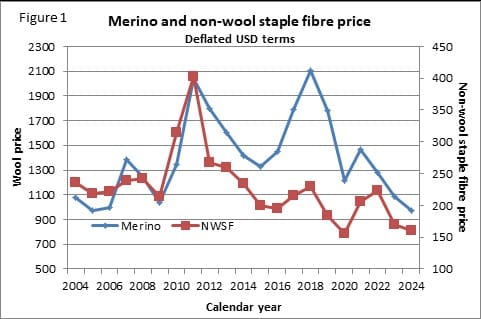
Figure 1 compares the annual average Merino wool price with a weighted average non-wool staple fibre (NWSF) price, both in deflated US dollar terms, for the past two decades. The two series follow similar cycles and trends, although the NWSF has a slight downward trend and the Merino price (at least to 2022) has had a slight upwards trend. The point of this schematic is that wool tends to rise and fall at similar times to the larger apparel fibre market.
So, what about the differing trends seen in Merino and the NWSF? Anyone who has been involved in the wool industry in recent decades will know there have been some changes.
Since 2004, the Australian Merino clip (auction sales) has shrunk by one third, going from 200 mkg clean to 140 mkg clean, and become 1.5 microns finer, moving from 20 to 18.5 micron. These are big structural changes which have driven the price of merino wool relative to other fibres higher.
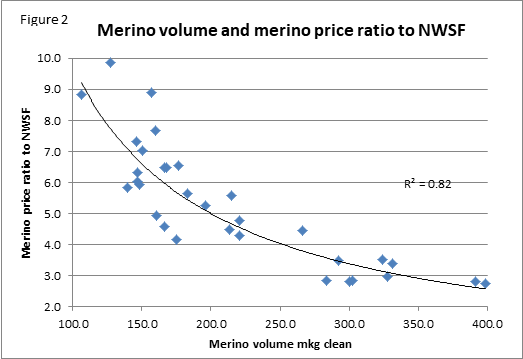
Figure 2 shows an example, where the price ratio for Merino to the NWSF series used in Figure 1, is compared to the Merino volume from the early 1990s onwards.
Astute readers will spot a potential problem of including the change of micron in the price in this comparison, but for the purposes of discussion let us persist noting the relationship holds very strongly for broad Merinos.
Bob Richardson, in his 2001 paper on wool marketing during the second half of the 20th century — The politics and economics of wool marketing: 1950-2000 — mentions the rule of thumb 3:1 ratio for wool to synthetics assumed to be sustainable during the 1980s. Diverging for a brief moment, this rule of thumb was ignored in the late 1980s when the floor price was elevated by the AWC to a ratio of 6-7 at a time of high production, with a very unhappy ending.
Figure 2 shows that as Australian Merino production has shrunk (and become finer), the trend price ratio (the line overlaid on the scatter plot) has increased. Around 2004, with production at 200 mkg, the trend ratio was around 5, well above the level of 3 of the 1990s.
Now with production around 140 mkg the trend ratio is around 7. There is plenty of variation around the trend, but the point is as the clip has shrunk in size and become finer, the trend price ratio of Merino to other apparel fibres has increased. This explains the differing trends seen in Figure 1 and highlights that discussion about wool prices needs to consider supply and quality.
AWI has been presenting a graph showing some interesting sales data for wool in China from selected marketing partners. It is interesting as this type of data is not generally available. It provides an opportunity to test the relationship of wool sales at the retail level to other fibre prices, to see if the correlation we see between fibre prices holds up.
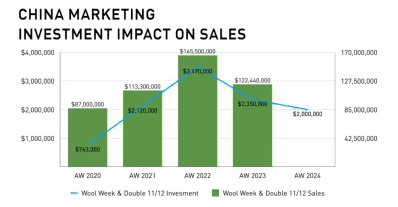 AWI/Woolmark general manager marketing and communications Laura Armstrong showed a Wool Week luncheon audience last week a graph indicating a correlation between year-on-year Woolmark investment in brand and media tactics (the blue line) and cumulative partner wool sales (the green bar) in China.
Figure 3 takes the AWI selected Chinese wool sales data (in millions of dollars) for 2020 through 2023 and compares them to the annual average non-wool staple fibre price used in the previous schematics. The comparison shows a very strong positive correlation, with the non-wool apparel fibre price accounting for 88 percnt of the retail wool sales. The result is as expected. Wool sales at the retail level follow a similar path to the other (larger) fibres.
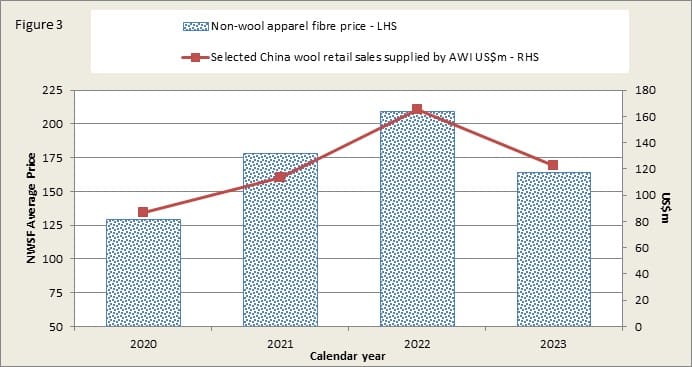
Claims about the effectiveness of wool marketing have to account firstly for the big driver of price, macroeconomic conditions, and then the secondary drivers, supply and quality. After the impact of these factors is removed, credit can then start to be allocated to the minor factors such as wool marketing. In the simple example above, it appears 88pc of the wool sales value can be accounted for by the general textile market conditions which presumably have nothing to do with wool marketing, leaving the minor effect of 12pc of sales value up for grabs.
Bob Richardson discusses marketers and their claims in his paper (focusing on the IWS in the 1980s), which should be required reading every few years by anyone with some connection to the wool industry.
In his conclusion, Bob reflected that agricultural economists did not challenge the Australian Wool Corporation enough during the 1970s and 1980s, partly because the AWC was responsible for the distribution of funds for such academic research on wool. This article is written with that reflection in mind.
Well done Andrew Woods for bringing these “smoke and mirror” assertions by AWI into focus. And also, for reminding us of the excellent commentary of AWC economist Bob Richardson, expressed in the last two lines above.
If The AWC board had had the wit to take Bob’s advice in respect to setting the Reserve Price in 1989, the Australian wool industry could have experienced a completely different fate. All the millions of dollars lost along the entire wool pipeline could have been preserved. Valuable capital lost that will never be replaced.
As a footnote, what on earth possessed Josh Lamb at Wool Week encouraging wool growers to pay a 2 percent levy. Josh, have you forgotten our history already?