Thunderstorms and showers produced moderate falls in northern Australia, while a surface trough and upper level disturbance led to thunderstorms and moderate rainfall over parts of eastern New South Wales. The highest weekly total was 233 mm at Upper Adelaide River, in the Northern Territory.
Past seven days: At the start of the week, isolated thunderstorms developed over the tropical north of the country. Particularly active areas over northern Western Australia, the Top End in the Northern Territory, the Gulf Country and the Cape York Peninsula resulted in moderate falls in these regions.
By the middle of the week, an extensive cloudband with embedded thunderstorm activity extended from central Western Australia, through South Australia to Victoria and New South Wales. The cloudband was associated with the passage of a surface trough and a cold front over southeastern Australia that generated mainly light falls in northern Tasmania, and isolated parts of Victoria, New South Wales and southern Queensland. Showers and thunderstorms continued to generate moderate falls in the Kimberley, the Top End and parts of the Cape York Peninsula throughout the remainder of the week. Onshore flow produced moderate falls along the north tropical coast of Queensland.
In the last part of the week, a broad area of low pressure over northern Australia combined with favourable surface conditions and resulted in enhanced convective activity over the Top End in the Northern Territory and the northern Kimberley in Western Australia. A surface trough located through inland New South Wales combined with an upper level disturbance and produced thunderstorms and moderate falls from the Central West Slopes and Plains to the Hunter coast, and also about parts of the northeast and central coast of New South Wales.
Rainfall totals in excess of 100 mm were recorded in coastal parts of the Top End in the Northern Territory, and at locations on the north tropical coast of Queensland.
Rainfall totals between 50 mm and 100 mm were recorded in parts of the Kimberley and Pilbara, the Top End in the Northern Territory, the Gulf coast, northern Cape York Peninsula, the north tropical coast of Queensland, and small areas along eastern New South Wales.
Rainfall totals between 10 mm and 50 mm were recorded in remaining parts of the Kimberley and much of the Pilbara; much of the northern half of the Northern Territory; far northern Queensland; areas of eastern New South Wales; and isolated areas in central Australia, southwest South Australia and western Tasmania.
Little or no rainfall was recorded in remaining parts of Western Australia; most of the southern half of the Northern Territory; much of South Australia; Queensland away from the north; western New South Wales, western and central northern Victoria, and eastern Tasmania.
Weekly rainfall totals map
Highest weekly totals
New South Wales and Australian Capital Territory
81 mm Ben Lomond (Beulah)
76 mm Richmond RAAF, Glen Alice
Victoria
10 mm Stratford, Mount Moornapa
9 mm Mt Sunday
Queensland
158 mm Scherger RAAF
119 mm South Johnstone Exp Stn
118 mm Piccaninny Plains Station
Western Australia
118 mm Kalumburu
106 mm Mornington
104 mm Debesa
South Australia
15 mm Ernabella (Pukatja)
10 mm Cook
8 mm Tarcoola (Commonwealth Hill)
Tasmania
15 mm Lake Margaret Power Station, Mount Read
11 mm Queenstown (South Queenstown)
Northern Territory
233 mm Upper Adelaide River
175 mm Croker Island Airport
145 mm Kidman Springs
More weekly rainfall totals:
- NSW/ACT totals click here
- Vic totals click here
- Qld totals click here
- WA totals click here
- SA totals click here
- Tas totals click here
- NT totals click here
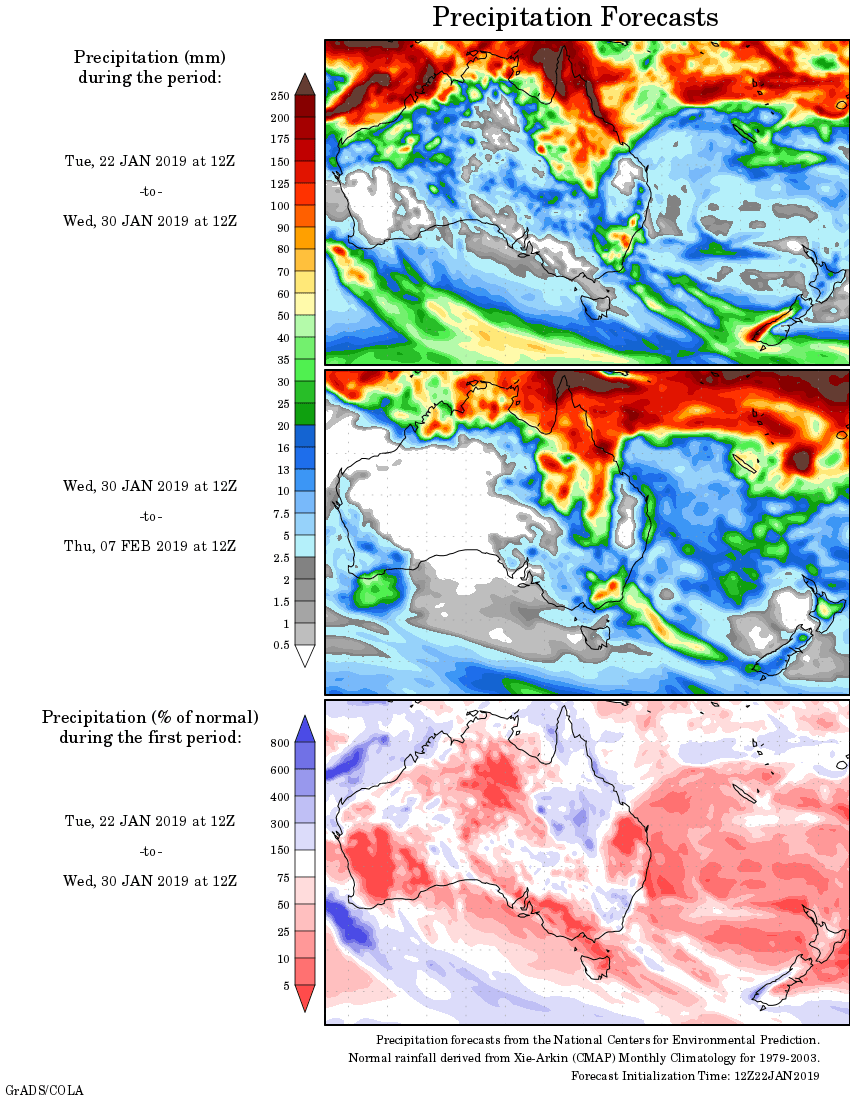
Rainfall outlook:


HAVE YOUR SAY