 PRODUCERS in parts of New South Wales and South Australia lead the nation in sheep flock growth in recent years, a map released by Meat & Livestock Australia has revealed.
MLA said across Australia, regions recording growth in sheep populations since 2013 are far and few in between – with climatic challenges and shifting production systems underpinning the flock decline over the past few years.
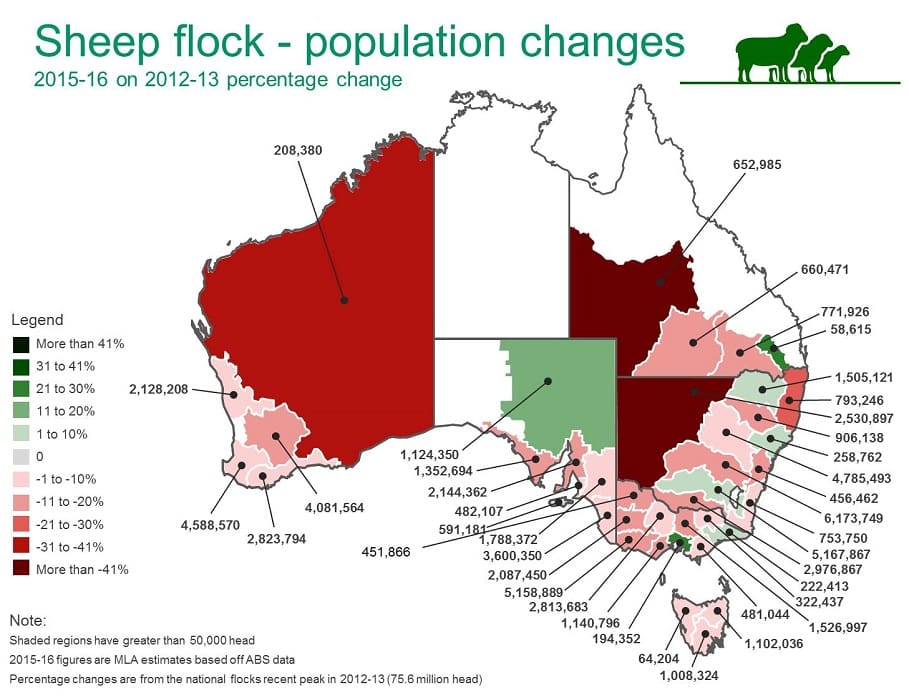
The map here illustrates the percentage change in each region from where the sheep flock was in 2012-13, to where it was estimated to be in 2015-16 (ABS, MLA). The varying shades of green or red represent the magnitude of rises and falls, respectively, and the numbers are the estimated sheep population in each region.
MLA said the large region in north-east South Australia recorded 11-20 percent flock growth, likely fuelled by above-average rainfall in that area over the past couple of years.
Results in New South Wales were mixed, largely due to very patchy rainfall during the drought period, which left many producers with little choice but to destock – particularly in the western parts of the state. A transition towards or incorporating cropping enterprises, particularly among younger generation producers, has also contributed to these declines in sheep numbers across NSW, MLA said. Some southern and north-eastern regions were the exceptions, with increases of up to 10pc estimated in these areas.
MLA said western regions of Victoria experienced very dry seasonal conditions during 2014-15 and 2015-16, with sheep numbers declining, while the shades of green around Gippsland region and the surrounds of Melbourne were likely to have been the result of better rainfall.
The WA sheep flock has contracted across all regions from 2012-13 to 2015-16, MLA said. Numbers in the highly sheep-populated areas in the south-west corner of the state declined up to 20pc, while the remaining northern and eastern regions were down between 31-41pc. The falling sheep population in WA is largely attributed to the shift in land use towards crop production, MLA said.
While regions in south-west Queensland experienced significant drought-induced reductions in sheep numbers, there was a pocket in the south-east part of the state that registered 21-30pc flock growth. Despite this area shaded green representing a relatively small proportion of Queensland’s total flock, it supports anecdotal evidence from MLA’s Lamb Forecasting Advisory Committee suggesting more producers are investing in fencing and that there is stronger interest in the sheep industry. Furthermore, the June MLA and AWI wool and sheep meat survey results for the number of lambs on hand versus expected lamb sales in Queensland indicate that some growers may be starting to rebuild their flocks.
MLA currently estimates the national sheep flock to be 70 million head, as at June 2016. Given the wide-spread drought has broken and assuming average seasonal conditions remain, the flock is expected to continue to recover towards 73 million head by 2020.
Click here to view the sheep flock map.
Source: MLA.


HAVE YOUR SAY